Compare commits
10 Commits
| Author | SHA1 | Date | |
|---|---|---|---|
| 5dbc2462bf | |||
| 2671f48489 | |||
| 3a18d01d17 | |||
| 564a47da69 | |||
| 9ba0c6abeb | |||
| cd00c2bfef | |||
| e06cadc67e | |||
| b83dd0acd9 | |||
| ced0898f84 | |||
| a558d1ae30 |

@@ -1,14 +1,10 @@
|
||||
---
|
||||
name: "source-command-opsx-apply"
|
||||
description: "Implement tasks from an OpenSpec change (Experimental)"
|
||||
name: "OPSX: Apply"
|
||||
description: Implement tasks from an OpenSpec change (Experimental)
|
||||
category: Workflow
|
||||
tags: [workflow, artifacts, experimental]
|
||||
---
|
||||
|
||||
# source-command-opsx-apply
|
||||
|
||||
Use this skill when the user asks to run the migrated source command `opsx-apply`.
|
||||
|
||||
## Command Template
|
||||
|
||||
Implement tasks from an OpenSpec change.
|
||||
|
||||
**Input**: Optionally specify a change name (e.g., `/opsx:apply add-auth`). If omitted, check if it can be inferred from conversation context. If vague or ambiguous you MUST prompt for available changes.
|
||||
@@ -1,14 +1,10 @@
|
||||
---
|
||||
name: "source-command-opsx-archive"
|
||||
description: "Archive a completed change in the experimental workflow"
|
||||
name: "OPSX: Archive"
|
||||
description: Archive a completed change in the experimental workflow
|
||||
category: Workflow
|
||||
tags: [workflow, archive, experimental]
|
||||
---
|
||||
|
||||
# source-command-opsx-archive
|
||||
|
||||
Use this skill when the user asks to run the migrated source command `opsx-archive`.
|
||||
|
||||
## Command Template
|
||||
|
||||
Archive a completed change in the experimental workflow.
|
||||
|
||||
**Input**: Optionally specify a change name after `/opsx:archive` (e.g., `/opsx:archive add-auth`). If omitted, check if it can be inferred from conversation context. If vague or ambiguous you MUST prompt for available changes.
|
||||
@@ -1,14 +1,10 @@
|
||||
---
|
||||
name: "source-command-opsx-explore"
|
||||
name: "OPSX: Explore"
|
||||
description: "Enter explore mode - think through ideas, investigate problems, clarify requirements"
|
||||
category: Workflow
|
||||
tags: [workflow, explore, experimental, thinking]
|
||||
---
|
||||
|
||||
# source-command-opsx-explore
|
||||
|
||||
Use this skill when the user asks to run the migrated source command `opsx-explore`.
|
||||
|
||||
## Command Template
|
||||
|
||||
Enter explore mode. Think deeply. Visualize freely. Follow the conversation wherever it goes.
|
||||
|
||||
**IMPORTANT: Explore mode is for thinking, not implementing.** You may read files, search code, and investigate the codebase, but you must NEVER write code or implement features. If the user asks you to implement something, remind them to exit explore mode first and create a change proposal. You MAY create OpenSpec artifacts (proposals, designs, specs) if the user asks—that's capturing thinking, not implementing.
|
||||
@@ -1,14 +1,10 @@
|
||||
---
|
||||
name: "source-command-opsx-propose"
|
||||
description: "Propose a new change - create it and generate all artifacts in one step"
|
||||
name: "OPSX: Propose"
|
||||
description: Propose a new change - create it and generate all artifacts in one step
|
||||
category: Workflow
|
||||
tags: [workflow, artifacts, experimental]
|
||||
---
|
||||
|
||||
# source-command-opsx-propose
|
||||
|
||||
Use this skill when the user asks to run the migrated source command `opsx-propose`.
|
||||
|
||||
## Command Template
|
||||
|
||||
Propose a new change - create the change and generate all artifacts in one step.
|
||||
|
||||
I'll create a change with artifacts:
|
||||
12
.gitignore
vendored
@@ -1,7 +1,7 @@
|
||||
# Tempary files
|
||||
temp
|
||||
sandbox.*
|
||||
/notes/
|
||||
notes/
|
||||
|
||||
# Environments
|
||||
.env
|
||||
@@ -22,11 +22,11 @@ secrets/
|
||||
SECRETS/
|
||||
secrets.bak/
|
||||
|
||||
# Claude Code
|
||||
.claude/settings.local.json
|
||||
# Claude
|
||||
.claudian
|
||||
|
||||
# Obsidian
|
||||
|
||||
.obsidian/*
|
||||
!.obsidian/snippets
|
||||
!.obsidian/app.json
|
||||
@@ -389,4 +389,8 @@ dist
|
||||
# Vite files
|
||||
vite.config.js.timestamp-*
|
||||
vite.config.ts.timestamp-*
|
||||
.vite/
|
||||
.vite/
|
||||
|
||||
|
||||
# Scipy
|
||||
!scipy_ndimage/*/**
|
||||
73
AGENTS.md
@@ -1,63 +1,3 @@
|
||||
# Bioxel Nodes
|
||||
|
||||
## 项目概览
|
||||
|
||||
Bioxel Nodes 是一个基于 Blender 的科学体数据可视化插件,利用 Blender 自带的 Geometry Nodes 与 Cycles(同时支持 EEVEE NEXT)处理并渲染体数据。
|
||||
|
||||
- 支持格式:`.dcm`、`.tif`/`.tiff`、`.nii`/`.nii.gz`、`.nrrd`、`.ome.tiff`、`.mrc`、`.h5` 等,完整列表见 `src/bioxelnodes/bioxel/data.py` 的 `SUPPORT_EXTS`
|
||||
- 支持 4D 体数据(多帧 / 多通道 / 时间序列)
|
||||
- v2.0.x 仅支持 Blender 5.0+
|
||||
- 核心依赖:SimpleITK、pyometiff、mrcfile、h5py、numpy、scipy、transforms3d、matplotlib
|
||||
|
||||
## 构建、测试与开发命令
|
||||
|
||||
- 环境:Python 3.11,依赖由 uv 管理(`uv.lock`)
|
||||
- `uv sync` 安装 / 同步依赖
|
||||
- `uv run pytest` 运行测试(当前暂无测试用例)
|
||||
- `uv run mkdocs serve` 本地预览文档;`uv run mkdocs build` 构建到 `site/`
|
||||
- `uv run mike deploy <version> -p` 发布版本化文档
|
||||
- `uv run build.py <platform> 3.11` 下载第三方 wheel 并更新 `src/bioxelnodes/blender_manifest.toml`,`platform` 取 `windows-x64` / `linux-x64` / `macos-arm64` / `macos-x64`
|
||||
- `python pack.py <platform> [output.zip]` 将 `src/bioxelnodes` 打包为 zip
|
||||
- 发布:推送 `v*` 标签触发 `.github/workflows/release.yml`,产物命名 `BioxelNodes.<version>.<platform>.zip`
|
||||
|
||||
## 架构
|
||||
|
||||
```text
|
||||
src/bioxelnodes/ 插件包根目录
|
||||
├── __init__.py 入口:register/unregister、CLI 命令与 WindowManager 属性
|
||||
├── auto_load.py 自动发现并按拓扑排序注册 bpy 类
|
||||
├── constants.py 常量(节点库路径等)
|
||||
├── preferences.py AddonPreferences(缓存目录)
|
||||
├── props.py PropertyGroup / UIList / 属性更新回调
|
||||
├── menus.py 菜单与右键菜单
|
||||
├── panels.py 面板
|
||||
├── asset_library.py "O Bioxel" 资产库管理
|
||||
├── node.py 节点组加载与添加
|
||||
├── layer.py VDB 缓存、快照、图层元数据(text datablock JSON)
|
||||
├── utils.py 通用工具(进度、对象查找、驱动等)
|
||||
├── exceptions.py 向后兼容占位(自定义异常已改用内置异常)
|
||||
├── blender_manifest.toml Blender 扩展清单
|
||||
├── assets/O_Bioxel/ 节点库 .blend 与资产目录
|
||||
├── wheels/ 随扩展分发的第三方 wheel
|
||||
├── bioxel/ 核心数据模型(不依赖 Blender)
|
||||
│ ├── data.py Data 类与解析(read / read_meta)
|
||||
│ ├── parse.py 解析函数(parse_volumetric_data 等)
|
||||
│ ├── layer.py Layer:TXYZC 顺序 ndarray + affine 变换
|
||||
│ ├── container.py Container:name + layers
|
||||
│ └── io.py HDF5 读写 Container
|
||||
└── operators/ Operator 实现
|
||||
├── io.py 导入 / 导出算子,启动后台导入进程
|
||||
├── io_worker.py 后台 CLI 导入 worker(bioxelnodes_import_worker)
|
||||
├── layer.py 图层管理算子
|
||||
├── node.py AddNode
|
||||
├── structure.py ExtractMesh
|
||||
└── misc.py 杂项算子
|
||||
```
|
||||
|
||||
数据流:导入时主进程通过 `operators/io.py` 启动一个后台 Blender 子进程(`blender --background --command bioxelnodes_import_worker`),由 `io_worker.py` 解析数据、生成 `Layer`,写为 VDB 缓存,并通过 JSON 文件(`progress.json` / `result.json` / `cancel`)回传进度与结果,避免阻塞 UI。
|
||||
|
||||
仓库根目录另有 `docs/`(mkdocs-material 文档,中英双语)、`openspec/`(spec-driven 变更流程)、`.agents/`(技能定义)。
|
||||
|
||||
## 总规范
|
||||
|
||||
- 说明性内容(例如提交说明、文档、注释、mermaid),以中文为主,专有名词、约定俗称可用英文
|
||||
@@ -77,16 +17,3 @@ src/bioxelnodes/ 插件包根目录
|
||||
- 使用的依赖越少越好
|
||||
- 选用简单直接的方式实现
|
||||
- 代码、执行方式改变,调整已有的文档、计划,而非新建
|
||||
|
||||
## Shell 规范
|
||||
|
||||
- 优先使用、提供 Git Bash 执行所有 Shell 命令
|
||||
- Windows 路径在 Bash 命令中优先使用正斜杠形式
|
||||
|
||||
## Blender 开发规范
|
||||
|
||||
- 插件、资产库压缩包名用大驼峰,如果需要,用`b45`来表示适用blender版本。比如`OmooLab.v0.1.0.b45.zip`
|
||||
- Operator、Menu、Panel、AddonPreferences... Class 用大驼峰命名,不加任何前缀。Operator 动宾结构,比如`RenderImage`。Menu、Panel 以它们本身为后缀,比如`RenderPanel`
|
||||
- 根据项目名提炼项目缩写,作为 bl_idname 和 自定义 Property 的前缀以区分其他功能和属性,以`Omoo`为例
|
||||
- bl_idname 用下划线小写命名,Operator 的 bl_idname 以`omoo.*`为前缀,比如`omoo.render_panel`;Menu 的以`OMOO_MT_*`为前缀;Panel 的以`OMOO_PT_*`为前缀。比如`OMOO_PT_render_panel`
|
||||
- 自定义 Property 用下划线小写命名,以`omoo_*`为前缀。比如`omoo_progress_factor`
|
||||
11
README.md
@@ -1,6 +1,4 @@
|
||||
**v2.0.x has been released, supporting only Blender 5.0+. The usage is completely different from before and is not compatible with old version files. See http://docs.omoolab.xyz/bioxelnodes/2.0.x/en/basics/**
|
||||
|
||||
[中文文档](https://docs.omoolab.xyz/bioxelnodes/latest/)
|
||||
[中文文档](https://uj6xfhbzp0.feishu.cn/wiki/LPKEwjooSivxjskWHlCcQznjnNf?from=from_copylink)
|
||||
|
||||
# Bioxel Nodes
|
||||
|
||||
@@ -28,7 +26,7 @@ Bioxel Nodes is a Blender addon for scientific volumetric data visualization. It
|
||||
| :--------------------------------------------------------------------: | :---------------------------------------------------------------------: |
|
||||
| Support 4D volumetric data | Real-time render with eevee |
|
||||
|
||||
**Read the [getting started](https://docs.omoolab.xyz/bioxelnodes/latest/en/installation) to begin your journey into visualizing volumetric data!**
|
||||
**Read the [getting started](https://omoolab.github.io/BioxelNodes/latest/installation) to begin your journey into visualizing volumetric data!**
|
||||
|
||||
Welcome to our [discord server](https://discord.gg/pYkNyq2TjE), if you have any problems with this add-on.
|
||||
|
||||
@@ -38,6 +36,11 @@ If you want to cite this work, you can cite it from Zenodo:
|
||||
|
||||
[](https://zenodo.org/badge/latestdoi/786623459)
|
||||
|
||||
## Known Limitations
|
||||
|
||||
- Only one cutter supported in EEVEE render
|
||||
- Shader fail to work when convert to mesh.
|
||||
- Section surface cannot be generated when convert to mesh (will be supported soon)
|
||||
|
||||
## Roadmap
|
||||
|
||||
|
||||
11
build.py
@@ -19,8 +19,7 @@ required_packages = ["SimpleITK==2.5.5",
|
||||
"transforms3d==0.4.2",
|
||||
"tifffile==2024.7.24",
|
||||
"matplotlib==3.10.7",
|
||||
"pillow==11.2.1",
|
||||
"scipy==1.16.3"]
|
||||
"pillow==11.2.1"]
|
||||
|
||||
|
||||
platforms = {"windows-x64": Platform(pypi_suffix="win_amd64",
|
||||
@@ -34,8 +33,7 @@ platforms = {"windows-x64": Platform(pypi_suffix="win_amd64",
|
||||
|
||||
packages_to_remove = {
|
||||
"imagecodecs",
|
||||
"numpy",
|
||||
"packaging"
|
||||
"numpy"
|
||||
}
|
||||
|
||||
|
||||
@@ -47,6 +45,7 @@ def run_python(args: str):
|
||||
def build_extension(platform: Platform, python_version: str) -> None:
|
||||
wheel_dirpath = Path("./src/bioxelnodes/wheels")
|
||||
toml_filepath = Path("./src/bioxelnodes/blender_manifest.toml")
|
||||
scipy_ndimage_dirpath = Path("./scipy_ndimage", platform.blender_tag)
|
||||
|
||||
# download required_packages
|
||||
run_python(
|
||||
@@ -63,6 +62,10 @@ def build_extension(platform: Platform, python_version: str) -> None:
|
||||
and "universal2" in f.name
|
||||
):
|
||||
f.rename(Path(f.parent, f.name.replace("universal2", "arm64")))
|
||||
|
||||
for ndimage_filepath in scipy_ndimage_dirpath.iterdir():
|
||||
to_filepath = Path("./src/bioxelnodes/bioxel/scipy", ndimage_filepath.name)
|
||||
shutil.copy(ndimage_filepath, to_filepath)
|
||||
|
||||
# Load the TOML file
|
||||
with toml_filepath.open("r") as file:
|
||||
|
||||
@@ -1,99 +0,0 @@
|
||||
# SARS-Cov-2
|
||||
|
||||

|
||||
|
||||

|
||||
|
||||
In this tutorial, we'll make a structural visualzation of the SARS-Cov-2 Virus. Please see [step by step](step_by_step.md) to make sure you have a basic understanding of how to use the addon, and make sure the addon version is v1.0.2 or higher!
|
||||
|
||||
Research data is from paper published in September 2020 in Cell Press ([https://www.cell.com/cell/fulltext/S0092-8674(20)31159-4](<https://www.cell.com/cell/fulltext/S0092-8674(20)31159-4>)) by Li Sai team at Tsinghua University. This research revealed the molecular assembly of the authentic SARS-CoV-2 virus using cryoelectron tomography (cryo-ET) and subtomogram averaging (STA). Here is an official video of this study
|
||||
|
||||
<iframe width="560" height="315" src="https://www.youtube.com/embed/JSKl5VY4k5w?si=t4LhrCRebxrX_Saf&controls=0" title="YouTube video player" frameborder="0" allow="accelerometer; autoplay; clipboard-write; encrypted-media; gyroscope; picture-in-picture; web-share" referrerpolicy="strict-origin-when-cross-origin" allowfullscreen></iframe>
|
||||
|
||||
"It remains enigmatic how coronaviruses pack the ∼30-kb RNA into the ∼80-nm-diameter viral lumen. Are the RNPs ordered relative to each other to avoid RNA entangling, knotting, or even damage or are they involved in virus assembly?" Three assembly classes were proposed in the paper, we will make a visualzation of the "eggs-in-a-nest"-shaped RNPs assembly, based on real cryo-ET data.
|
||||
|
||||
## Download and import data
|
||||
|
||||
The data of this research is hosted on EMDB ([https://www.ebi.ac.uk/emdb](https://www.ebi.ac.uk/emdb)), and the website of SARS-Cov-2 virus is [here](https://www.ebi.ac.uk/emdb/EMD-30430). Open the page, find "Download" button and select the first selection "3D Volume (.map.gz)".
|
||||
|
||||
In case you can't download data, you can download here.
|
||||
|
||||
[SARS-Cov-2.map](https://drive.google.com/file/d/1LMybsmTVbwQ38_eqAx6hbZTc5p2fdcjK/view?usp=sharing)
|
||||
|
||||
After downloading, put it into any directory and import the data. In the import options, it is recommended to adjust the Bioxel Size to 5, in order to reduce the shape of the data to increase the speed of calculation and rendering. If you are confident in the performance of your hardware, you can leave the original 2.72 unchanged. After adjusting the Bioxel Size, the shape of the converted data will be calculated below based on the current bioxel size. The amount of data will increase exponentially with larger shape, and may result in OOM (out of memory).
|
||||
|
||||
## Cutout the Virus
|
||||
|
||||
After importing, you can get the virus by creating and connecting nodes and setting parameters as shown below
|
||||
|
||||

|
||||
|
||||
Place the light and the camera in the way as below. The backlight is a area light, color white, intensity 500W, spread 90°, and inside the virus, place a point light, color `FFD08D`, intensity 5W. Camera focal length is 200 mm. the background color is pure black. The Look of the color management is High Contrast.
|
||||
|
||||

|
||||
|
||||
Continue editing the node, followed by "Set Properies" and "Set Color by Ramp 4" node, the parameters of these two nodes are set as shown in the figure, where the color part, from top to bottom, is set to `E1D0FC` (1.0), `FFE42D` (0.5), `3793FF` (0.5), `FFFF8EC` (0.1) (alpha value in parentheses). Color alpha also affects density.
|
||||
|
||||

|
||||
|
||||
If you feel that rendering is too slow, see [here](improve_performance.md) for suggestions
|
||||
|
||||
## Color the RNPs alone
|
||||
|
||||
The current rendering is pretty good, but considering that my goal is to make it clear how the RNPs are arranged within the virus, the RNPs should be colored differently than the others. So how to color the RNPs alone?
|
||||
|
||||
First of all, we have to separate the RNPs. The value of RNPs is between the membrane and S protein, so it is very difficult to separate. The good thing is that the virus is spherical, we can separate the RNPs part of the virus from the rest by using a sphere cutter. To do so, in the Geometry Nodes panel menu of the container, click **Bioxel Nodes > Add a Cutter > Sphere Cutter**, and adjust the scale and position of the newly created sphere object named "Sphere_Cutter" appropriately, so that it can just separate the internal RNPs and membrane of the virus.
|
||||
|
||||

|
||||
|
||||
The process of changing the position of the "Sphere_Cutter" object can be very laggy, then you can turn off "With Surface" and do it in Slice Viewer mode. Once you are happy with it, you can restore the settings.
|
||||
|
||||
Then we turn on Invert in the "Sphere Cutter" node and you can see the opposite result. This way we've managed to separate the two, next let's color them separately and finally merge them with Join Component. Create and join the nodes as shown below, where the second Cutter node is copied and the color value in Set Color is `FFDDFE` (0.5). If all is well, the rendering should look like below.
|
||||
|
||||

|
||||
|
||||
At this point, the rendering of a SARS-Cov-2 virus is complete!
|
||||
|
||||
## Render RNPs and Membranes
|
||||
|
||||
Realistic rendering is great, but Non-photorealistic rendering (NPR) is better for presenting structural information. So I will render ultrastructure of the RNPs assembly with toon shader.
|
||||
|
||||

|
||||
|
||||
The silhouettes of RNPs uses Blender's Line Art feature, but Line Art must be based on a mesh. Select the nodes that are extruding the RNPs (i.e., the "Cut" nodes that are in charge of cutting out the RNPs), and right-click, click **Bioxel Nodes > Extract Mesh**. This gives you a new mesh object of the RNPs.
|
||||
|
||||
Extract the membrane mesh in the same way.
|
||||
|
||||
The membrane has a much higher value than the rest of the virus, so let's create a new "Cutout" node, also after the ReCenter, but with the threshold adjusted to 0.13. After the Cutout, connect to the "To Surface" node and parameterize it as shown in the figure, noting that the Remove Island Threshold is set to 1000 so that any fragments smaller than 1000 pts be eliminated. Then select the "To Surface" node, and perform the operation of extracting the mesh.
|
||||
|
||||

|
||||
|
||||
The mesh of the membrane needs to be cut in half, this can be done with the Box Trim brush in sculpt mode or with the Boolean modifier. the mesh of the RNPs may also need some repair work, I cleaned up some of the broken surfaces of the RNPs. all the meshes are now ready to be used.
|
||||
|
||||

|
||||
|
||||
For Line Art, please see the video tutorial from Blender Secrets.
|
||||
|
||||
<iframe width="560" height="315" src="https://www.youtube.com/embed/aIWdBq7-ias?si=CrcStx5VVJBwDpzu&controls=0" title="YouTube video player" frameborder="0" allow="accelerometer; autoplay; clipboard-write; encrypted-media; gyroscope; picture-in-picture; web-share" referrerpolicy="strict-origin-when-cross-origin" allowfullscreen></iframe>
|
||||
|
||||
Finally, an infographic on the ultrastructure of RNPs is done!
|
||||
|
||||

|
||||
|
||||
If you have trouble following the docs, you can download the project files.
|
||||
|
||||
[SARS-Cov-2.zip](https://drive.google.com/file/d/15GpIoIjVAE-Jr98zWo7oupuk1KfRVPmk/view?usp=sharing)
|
||||
|
||||
## Homework
|
||||
|
||||
Other data relevant to the study are provided in the paper, you could try visualizing them.
|
||||
|
||||

|
||||
|
||||
Go to the official EMDB website https://www.ebi.ac.uk/emdb/ and enter the EMD number in the search box to get them.
|
||||
|
||||
The Electron Microscopy Data Bank (EMDB) is a public repository for cryogenic-sample Electron Microscopy (cryoEM) volumes and representative tomograms of macromolecular complexes and subcellular structures. If you want to get data on other virus, just enter their name in the search box. For example, hepatitis B virus, enter it into the search box, then select Virus in the Sample Type on the left side, and download the data you need (it is better to find the corresponding paper to clarify the data information).
|
||||
|
||||
**Try to visualize hepatitis B virus.**
|
||||
|
||||

|
||||
@@ -4,96 +4,96 @@
|
||||
|
||||

|
||||
|
||||
在本教程中,我们将制作 SARS-Cov-2 病毒的结构可视化。请确保您已阅读[分步指南](step_by_step.md)以了解插件的基本使用方法,并确保插件版本为 v1.0.2 或更高!
|
||||
In this tutorial, we'll make a structural visualzation of the SARS-Cov-2 Virus. Please see [step by step](step_by_step.md) to make sure you have a basic understanding of how to use the addon, and make sure the addon version is v1.0.2 or higher!
|
||||
|
||||
研究数据来自 2020 年 9 月发表在 Cell Press 的论文([https://www.cell.com/cell/fulltext/S0092-8674(20)31159-4](<https://www.cell.com/cell/fulltext/S0092-8674(20)31159-4>)),作者是清华大学李赛团队。该研究使用冷冻电子断层扫描(cryo-ET)和亚断层图平均(STA)揭示了真实 SARS-CoV-2 病毒的分子组装。以下是该研究的官方视频:
|
||||
Research data is from paper published in September 2020 in Cell Press ([https://www.cell.com/cell/fulltext/S0092-8674(20)31159-4](<https://www.cell.com/cell/fulltext/S0092-8674(20)31159-4>)) by Li Sai team at Tsinghua University. This research revealed the molecular assembly of the authentic SARS-CoV-2 virus using cryoelectron tomography (cryo-ET) and subtomogram averaging (STA). Here is an official video of this study
|
||||
|
||||
<iframe width="560" height="315" src="https://www.youtube.com/embed/JSKl5VY4k5w?si=t4LhrCRebxrX_Saf&controls=0" title="YouTube video player" frameborder="0" allow="accelerometer; autoplay; clipboard-write; encrypted-media; gyroscope; picture-in-picture; web-share" referrerpolicy="strict-origin-when-cross-origin" allowfullscreen></iframe>
|
||||
|
||||
"冠状病毒如何将约 30kb 的 RNA 包装到约 80nm 直径的病毒腔内仍然是个谜。RNP 彼此之间是否有序以避免 RNA 缠结、打结或损坏,还是它们参与病毒组装?" 论文中提出了三类组装方式,我们将基于真实的冷冻电镜数据,制作"巢中蛋"形 RNP 组装的可视化。
|
||||
"It remains enigmatic how coronaviruses pack the ∼30-kb RNA into the ∼80-nm-diameter viral lumen. Are the RNPs ordered relative to each other to avoid RNA entangling, knotting, or even damage or are they involved in virus assembly?" Three assembly classes were proposed in the paper, we will make a visualzation of the "eggs-in-a-nest"-shaped RNPs assembly, based on real cryo-ET data.
|
||||
|
||||
## 下载和导入数据
|
||||
## Download and import data
|
||||
|
||||
该研究的数据托管在 EMDB([https://www.ebi.ac.uk/emdb](https://www.ebi.ac.uk/emdb)),SARS-Cov-2 病毒网站是[这里](https://www.ebi.ac.uk/emdb/EMD-30430)。打开页面,找到"Download"按钮,选择第一个选项"3D Volume (.map.gz)"。
|
||||
The data of this research is hosted on EMDB ([https://www.ebi.ac.uk/emdb](https://www.ebi.ac.uk/emdb)), and the website of SARS-Cov-2 virus is [here](https://www.ebi.ac.uk/emdb/EMD-30430). Open the page, find "Download" button and select the first selection "3D Volume (.map.gz)".
|
||||
|
||||
如果您无法下载数据,可以从这里下载。
|
||||
In case you can't download data, you can download here.
|
||||
|
||||
[SARS-Cov-2.map](https://drive.google.com/file/d/1LMybsmTVbwQ38_eqAx6hbZTc5p2fdcjK/view?usp=sharing)
|
||||
|
||||
下载后,放到任意目录并导入数据。在导入选项中,建议将 Bioxel Size 调整为 5,以减小数据形状,提高计算和渲染速度。如果您对硬件性能有信心,可以保持原始的 2.72 不变。调整 Bioxel Size 后,下方会根据当前的 bioxel size 计算转换后数据的形状。数据量会随着形状增大呈指数增长,可能会导致内存不足(OOM)。
|
||||
After downloading, put it into any directory and import the data. In the import options, it is recommended to adjust the Bioxel Size to 5, in order to reduce the shape of the data to increase the speed of calculation and rendering. If you are confident in the performance of your hardware, you can leave the original 2.72 unchanged. After adjusting the Bioxel Size, the shape of the converted data will be calculated below based on the current bioxel size. The amount of data will increase exponentially with larger shape, and may result in OOM (out of memory).
|
||||
|
||||
## 切割病毒
|
||||
## Cutout the Virus
|
||||
|
||||
导入后,您可以通过创建和连接节点并设置参数来获取病毒,如下图所示。
|
||||
After importing, you can get the virus by creating and connecting nodes and setting parameters as shown below
|
||||
|
||||

|
||||
|
||||
按下图所示放置灯光和相机。背光是区域光,白色,强度 500W,扩散 90°;在病毒内部放置一个点光源,颜色 `FFD08D`,强度 5W。相机焦距为 200mm。背景颜色为纯黑色。颜色管理的 Look 为 High Contrast。
|
||||
Place the light and the camera in the way as below. The backlight is a area light, color white, intensity 500W, spread 90°, and inside the virus, place a point light, color `FFD08D`, intensity 5W. Camera focal length is 200 mm. the background color is pure black. The Look of the color management is High Contrast.
|
||||
|
||||

|
||||
|
||||
继续编辑节点,接着是"Set Properties"和"Set Color by Ramp 4"节点,这两个节点的参数设置如下图,其中颜色部分,从上到下设置为 `E1D0FC`(1.0)、`FFE42D`(0.5)、`3793FF`(0.5)、`FFFF8EC`(0.1)(括号中为 alpha 值)。颜色的 alpha 值也会影响密度。
|
||||
Continue editing the node, followed by "Set Properies" and "Set Color by Ramp 4" node, the parameters of these two nodes are set as shown in the figure, where the color part, from top to bottom, is set to `E1D0FC` (1.0), `FFE42D` (0.5), `3793FF` (0.5), `FFFF8EC` (0.1) (alpha value in parentheses). Color alpha also affects density.
|
||||
|
||||

|
||||
|
||||
如果您觉得渲染太慢,请参阅[这里](improve_performance.md)获取建议。
|
||||
If you feel that rendering is too slow, see [here](improve_performance.md) for suggestions
|
||||
|
||||
## 单独为 RNP 着色
|
||||
## Color the RNPs alone
|
||||
|
||||
当前的渲染效果很好,但考虑到我的目标是让您清楚看到 RNP 在病毒内部的排列方式,RNP 应该与其他部分用不同颜色着色。那么如何单独为 RNP 着色呢?
|
||||
The current rendering is pretty good, but considering that my goal is to make it clear how the RNPs are arranged within the virus, the RNPs should be colored differently than the others. So how to color the RNPs alone?
|
||||
|
||||
首先,我们必须分离 RNP。RNP 的值介于膜和 S 蛋白之间,因此很难分离。好在病毒是球形的,我们可以使用球形切割器将病毒的 RNP 部分与其余部分分离。为此,在容器的几何节点面板菜单中,点击 **Bioxel Nodes > Add a Cutter > Sphere Cutter**,并适当调整新创建的名为"Sphere_Cutter"的球体对象的大小和位置,使其恰好能将病毒内部的 RNP 和膜分离。
|
||||
First of all, we have to separate the RNPs. The value of RNPs is between the membrane and S protein, so it is very difficult to separate. The good thing is that the virus is spherical, we can separate the RNPs part of the virus from the rest by using a sphere cutter. To do so, in the Geometry Nodes panel menu of the container, click **Bioxel Nodes > Add a Cutter > Sphere Cutter**, and adjust the scale and position of the newly created sphere object named "Sphere_Cutter" appropriately, so that it can just separate the internal RNPs and membrane of the virus.
|
||||
|
||||

|
||||
|
||||
改变"Sphere_Cutter"对象的位置可能会非常卡顿,此时您可以关闭"With Surface"并在 Slice Viewer 模式下操作。满意后,恢复设置。
|
||||
The process of changing the position of the "Sphere_Cutter" object can be very laggy, then you can turn off "With Surface" and do it in Slice Viewer mode. Once you are happy with it, you can restore the settings.
|
||||
|
||||
然后在"Sphere Cutter"节点中打开 Invert,您可以看到相反的结果。这样我们就成功将两者分离了。接下来让我们分别着色,最后用 Join Component 合并。按如下图所示创建和连接节点,其中第二个 Cutter 节点是复制的,Set Color 中的颜色值设置为 `FFDDFE`(0.5)。如果一切正常,渲染结果应该如下图所示。
|
||||
Then we turn on Invert in the "Sphere Cutter" node and you can see the opposite result. This way we've managed to separate the two, next let's color them separately and finally merge them with Join Component. Create and join the nodes as shown below, where the second Cutter node is copied and the color value in Set Color is `FFDDFE` (0.5). If all is well, the rendering should look like below.
|
||||
|
||||

|
||||
|
||||
此时,SARS-Cov-2 病毒的渲染完成了!
|
||||
At this point, the rendering of a SARS-Cov-2 virus is complete!
|
||||
|
||||
## 渲染 RNP 和膜
|
||||
## Render RNPs and Membranes
|
||||
|
||||
写实渲染很棒,但非写实渲染(NPR)在呈现结构信息方面更好。因此,我将使用卡通着色器来渲染 RNP 组装的首尾结构。
|
||||
Realistic rendering is great, but Non-photorealistic rendering (NPR) is better for presenting structural information. So I will render ultrastructure of the RNPs assembly with toon shader.
|
||||
|
||||

|
||||
|
||||
RNP 的轮廓使用 Blender 的线稿(Line Art)功能,但线稿必须基于网格。选择挤出 RNP 的节点(即负责切割出 RNP 的"Cut"节点),右键点击 **Bioxel Nodes > Extract Mesh**。这将为您创建一个 RNP 的新网格对象。
|
||||
The silhouettes of RNPs uses Blender's Line Art feature, but Line Art must be based on a mesh. Select the nodes that are extruding the RNPs (i.e., the "Cut" nodes that are in charge of cutting out the RNPs), and right-click, click **Bioxel Nodes > Extract Mesh**. This gives you a new mesh object of the RNPs.
|
||||
|
||||
用同样的方式提取膜网格。
|
||||
Extract the membrane mesh in the same way.
|
||||
|
||||
膜的病毒值远高于其他部分,因此让我们创建一个新的"Cutout"节点,同样在 ReCenter 之后,但阈值调整为 0.13。Cutout 后,连接到"To Surface"节点并按如下图所示设置参数,注意 Remove Island Threshold 设置为 1000,以便消除小于 1000 pts 的任何碎片。然后选择"To Surface"节点,执行提取网格的操作。
|
||||
The membrane has a much higher value than the rest of the virus, so let's create a new "Cutout" node, also after the ReCenter, but with the threshold adjusted to 0.13. After the Cutout, connect to the "To Surface" node and parameterize it as shown in the figure, noting that the Remove Island Threshold is set to 1000 so that any fragments smaller than 1000 pts be eliminated. Then select the "To Surface" node, and perform the operation of extracting the mesh.
|
||||
|
||||

|
||||
|
||||
膜的网格需要切成两半,这可以通过雕刻模式中的 Box Trim 笔刷或布尔修改器来完成。RNP 的网格也可能需要一些修复工作,我清理了一些 RNP 的破损表面。所有网格现在都可以使用了。
|
||||
The mesh of the membrane needs to be cut in half, this can be done with the Box Trim brush in sculpt mode or with the Boolean modifier. the mesh of the RNPs may also need some repair work, I cleaned up some of the broken surfaces of the RNPs. all the meshes are now ready to be used.
|
||||
|
||||

|
||||
|
||||
关于线稿,请参阅 Blender Secrets 的视频教程。
|
||||
For Line Art, please see the video tutorial from Blender Secrets.
|
||||
|
||||
<iframe width="560" height="315" src="https://www.youtube.com/embed/aIWdBq7-ias?si=CrcStx5VVJBwDpzu&controls=0" title="YouTube video player" frameborder="0" allow="accelerometer; autoplay; clipboard-write; encrypted-media; gyroscope; picture-in-picture; web-share" referrerpolicy="strict-origin-when-cross-origin" allowfullscreen></iframe>
|
||||
|
||||
最后,RNP 超微结构的信息图完成了!
|
||||
Finally, an infographic on the ultrastructure of RNPs is done!
|
||||
|
||||

|
||||
|
||||
如果您按照文档有困难,可以下载项目文件。
|
||||
If you have trouble following the docs, you can download the project files.
|
||||
|
||||
[SARS-Cov-2.zip](https://drive.google.com/file/d/15GpIoIjVAE-Jr98zWo7oupuk1KfRVPmk/view?usp=sharing)
|
||||
|
||||
## 作业
|
||||
## Homework
|
||||
|
||||
论文中提供了其他相关数据,您可以尝试可视化它们。
|
||||
Other data relevant to the study are provided in the paper, you could try visualizing them.
|
||||
|
||||

|
||||
|
||||
前往官方 EMDB 网站 https://www.ebi.ac.uk/emdb/,在搜索框中输入 EMD 编号即可获取。
|
||||
Go to the official EMDB website https://www.ebi.ac.uk/emdb/ and enter the EMD number in the search box to get them.
|
||||
|
||||
电子显微镜数据银行(EMDB)是一个公共仓库,用于存放冷冻样品的电子显微镜(cryoEM)体积和代表性断层图。如果您想获取其他病毒的数据,只需在搜索框中输入其名称即可。例如,乙型肝炎病毒,在搜索框中输入,然后选择左侧 Sample Type 中的 Virus,下载您需要的数据(最好找到相应的论文来明确数据信息)。
|
||||
The Electron Microscopy Data Bank (EMDB) is a public repository for cryogenic-sample Electron Microscopy (cryoEM) volumes and representative tomograms of macromolecular complexes and subcellular structures. If you want to get data on other virus, just enter their name in the search box. For example, hepatitis B virus, enter it into the search box, then select Virus in the Sample Type on the left side, and download the data you need (it is better to find the corresponding paper to clarify the data information).
|
||||
|
||||
**尝试可视化乙型肝炎病毒。**
|
||||
**Try to visualize hepatitis B virus.**
|
||||
|
||||

|
||||

|
||||
|
||||
@@ -1,46 +0,0 @@
|
||||
# Advanced Usage
|
||||
|
||||
## Cut "Structure"
|
||||
|
||||
"Structure" can be cut to show partial structure, accomplished through the O Cut series nodes. For example, add the **O Cut to Region** node as shown below and connect it. Add any object from the scene as the "Region", and input it into the node:
|
||||
|
||||

|
||||
|
||||
By properly adjusting the position and rotation of the "Region" object, you can see that the skull structure is confined within the region.
|
||||
|
||||
!!! note
|
||||
The add-on provides a function to quickly make objects phantom. In 3D Viewport mode, right-click the "Region" object and select **Bioxel Nodes > Toggle Phantom** from the menu.
|
||||
|
||||
!!! warning
|
||||
Cutting increases computation and affects real-time performance. Check Resample on O Layer to improve performance.
|
||||
|
||||
**O Cut Small Parts** node is a cleanup tool that quickly removes scattered fragments and keeps only clean, continuous large structures. However, the computation is particularly time-consuming, so be aware of performance.
|
||||
|
||||

|
||||
|
||||
If you are familiar with geometry nodes, you can also directly define the cutting execution range through **O Cut Structure**. For example, in the image below, select the part where the cutting position X is greater than 0.
|
||||
|
||||

|
||||
|
||||
## Structure Property Settings
|
||||
|
||||
Expand the Properties of **O Cutout by Threshold**, where you can directly modify various property values, but they can only be set uniformly. We can use field-type data to assign differences. Take the color property as an example: for instance, connecting a Position node directly produces the effect shown below:
|
||||
|
||||

|
||||
|
||||
We can also map layer values to color gradients, which requires the **O Scalar Layer to Color** node (such conversion function nodes are all under Add > O Bioxel > Utilities in the node menu). Adjust as follows:
|
||||
|
||||
- **O Cutout by Threshold**: Set Threshold to 20
|
||||
- **O Scalar Layer to Color**: Set From Min and From Max to 20 and 90 respectively
|
||||
|
||||

|
||||
|
||||
Since soft tissue CT values are lower than bone tissue, when the threshold is lowered, you can see that in addition to the skull, the attached soft tissue is also presented. The From Min and From Max of **O Scalar Layer to Color** define the color mapping range from 0 to 1. Therefore, low-value soft tissue appears black, and high-value bone tissue appears white.
|
||||
|
||||
We can also customize the mapping method through the **Closure** node in Blender 5.0+. For example, connect a **Color Ramp** node to change the black area belonging to soft tissue to dark red:
|
||||
|
||||

|
||||
|
||||
Ta-da! The anatomical rendering is done!
|
||||
|
||||
Other "Structure" properties can also be adjusted in this way. In addition to **O Scalar Layer to Color**, there is also **O Scalar Layer to Factor** to convert to a single value from 0 to 1.
|
||||
@@ -1,49 +0,0 @@
|
||||
# 高级玩法
|
||||
|
||||
## 切割「结构体」
|
||||
|
||||
「结构体」可以被切割,呈现部分结构,通过 O Cut 系列节点完成。比如按下图添加 **O Cut to Region** 节点并连接,添加任意来自场景的物体作为「区域」,输入到节点:
|
||||
|
||||

|
||||
|
||||
适当调整作为「区域」物体的位置旋转,可以看到头骨结构被限制在区域范围内。
|
||||
|
||||
!!! note
|
||||
插件提供快速让物体虚化的功能,在 3D 视图模式下,右键「区域」物体,菜单选择 **Bioxel Nodes > Toggle Phantom**
|
||||
|
||||
!!! warning
|
||||
切割会增加计算量,影响实时性能,勾选 O Layer 的 Resample 来提高性能
|
||||
|
||||
|
||||
|
||||
**O Cut Small Parts** 节点,是清理神器,能快速把零碎的结构删除,只干净连续的大结构。但是计算特别耗时,注意性能。
|
||||
|
||||

|
||||
|
||||
如果你对几何节点很了解,你也可以通过 **O Cut Structure** 直接定义切割的执行范围,比如下图中,选择切割位置 X 大于 0 的部分。
|
||||
|
||||

|
||||
|
||||
|
||||
## 「结构体」属性设置
|
||||
|
||||
展开 **O Cutout by Threshold** 的 Properties,你可以直接修改各项属性值,但都只能均一设置,我们可以用场类型数据赋予差异。以颜色属性为例,比如直接接入 Position 节点,效果如下:
|
||||
|
||||

|
||||
|
||||
我们还可以把数据层的值映射为颜色渐变,这里需要用到 **O Scalar Layer to Color** 节点(这类转换功能的节点都在节点菜单,Add > O Bioxel > Utilities 下)。调整如下
|
||||
|
||||
- **O Cutout by Threshold**:Threshold 设置为 20
|
||||
- **O Scalar Layer to Color**:From Min 和 From Max 分别设置为 20 和 90
|
||||
|
||||

|
||||
|
||||
由于软组织的 CT 值小于骨质,当阈值降低,可以看到除了头骨外,附着的软组织也被呈现了出来。**O Scalar Layer to Color** 的 From Min 和 From Max,定义了颜色从 0~1 的取值范围。因此低值的软组织呈现黑色,高值的骨质呈现白色
|
||||
|
||||
我们还可以通过 Blender 5.0+ 的 **Closure** 节点来自定义映射方式。比如连接 **Color Ramp** 节点,把属于软组织的黑区,改为暗红色
|
||||
|
||||

|
||||
|
||||
哒哒!解剖渲染就做好啦👍
|
||||
|
||||
其他「结构体」属性也可以按这样的方式调整,除了 **O Scalar Layer to Color**,还有 **O Scalar Layer to Factor** 来转换为 0~1 的单值
|
||||
118
docs/advanced_usage.md
Normal file
@@ -0,0 +1,118 @@
|
||||
# Advanced Usage
|
||||
|
||||
## Concepts
|
||||
|
||||
In the previous section, I mentioned some key concepts, I'll describe them in detail so that you can better understand the following operations.
|
||||
|
||||
### Container
|
||||
|
||||
First is the **Container**, it is the easiest to describe, you can think of it as a scene, or a solver container. it is the stage that carries all stuffs.
|
||||
|
||||
### Layer
|
||||
|
||||
Second is the **Layer**, which represents different fields of data under the same location in container of the same subject. Just as view layers in any map app, one as roads, one as satellite view, while in Bioxel, one as MRI, one as CT, one as electrical signals, etc. Some layers are for material, such as color, density, etc., we call them **Material Layer**. One container contains different layers of one subject each. Any external data imported into the container is converted into the layer.
|
||||
|
||||
### Component
|
||||
|
||||
Finally, the **Component**, which is a fragment of **Material Layer**. Multiple materials (Matters) may exist within the same area with different meanings of presentation, like objects in blender, each representing a part of the scene. Bioxel Nodes provides a series of nodes and tools that allow the user to create material layers (Components) based on the other layers (serve as source data), In the previous section, we used the CT data (layer) to make the material (matter) of skull, this process known as materialization.
|
||||
|
||||
## Attache the Muscles to the Skull
|
||||
|
||||
Multiple components can exist in one container, just as multiple objects can exist in one scene. They can be controlled individually or combined with each other to build complex scenes. Next, let's try cutouting muscle from the VHP anatomical images and attaching the muscles to the skull that created in the previous section. The anatomical images are very large, so I've cropped and scaled them down to 1/4 of their original size for ease of use. Download the file and unzip it into a new directory.
|
||||
|
||||
[VHP_M_AnatomicalImages_Head.zip](https://drive.google.com/file/d/164AjQX0tmgUpWZlleJ5i1IKHco4ytDu2/view?usp=drive_link)
|
||||
|
||||
You can also download the data directly from the official website, [https://data.lhncbc.nlm.nih.gov/public/Visible-Human/Male-Images/PNG_format/head/index.html](https://data.lhncbc.nlm.nih.gov/public/Visible-Human/Male-Images/PNG_format/head/index.html)
|
||||
|
||||
First import the CT data as described in [step by step](step_by_step.md). Then import the anatomical images, but unlike before, this time from the Geometry Nodes menu of the existing container (not the top menu), click **Bioxel Nodes > Import Volumetric Data (Init) > as Color**, locate to the unzipped folder, and select any .png file (do not multi-select, and do not select the folder). This way the imported layer will be in the same container as the previous CT data. You can also import by dragging it into the container geometry node interface instead of the 3D Viewport interface. Also note that **as Color** (not as Scalar) is clicked because the anatomical images are RGB data.
|
||||
|
||||

|
||||
|
||||
Let's take more time in the import options this time 🫡, first let's talk about what the **Original Spacing** is in the options, you can simply think of it as the original "pixel size" of a image, since the volume is 3D, its pixels (i.e., voxels) are cuboids with a length, width, and height rather than 2D rectangles. And their length, width, and height size is the **Spacing**.
|
||||
|
||||
Normally, Bioxel Nodes can read the spacing from the data header, and you don't need to fill in the value, but there is no record of that in any PNG image, so you need to input it manually. in the official description of the VHP, it is mentioned that each pixel of the anatomical images corresponds to the size of .33mm, and the thickness of each slice is 1mm, so the Original Spacing of the anatomical images should be set to `(0.33, 0.33, 1)`.
|
||||
|
||||
However, the file I provided is scaled by 1/4 for each image, so the X and Y axes need to be multiplied by 4. So the final Original Spacing should be set to `(1.33, 1.33, 1)`, which should be understandable, right? (If you are importing an official file, then it should still be set to `(0.33, 0.33, 1)`)
|
||||
Layer Name should be set to "Anatomical Images", other options remain default, click Ok.
|
||||
|
||||

|
||||
|
||||
After importing, connect the "Cutout by Hue" node (Add > Bioxel Nodes > Component > Cutout by Hue) after the newly created "Fetch Layer" node, and turn on the Slice Viewer mode preview, as shown below.
|
||||
|
||||

|
||||
|
||||
In addition to spacing, the Dicom file also records the subject's position and orientation, but those information is apparently not recorded in PNG format. This results in a mismatch between the CT data and the anatomical images in position. We need to manually align this two layers: First, set the threshold of the "Cutout by Threshold" node to 0.2 so that the full head can be cutouted and displayed. Then add "ReCenter" node before "Cutout by Hue" node and "Cutout by Threshold" node each, then add Locater to the "anatomical images" workflow (see [step by step](step_by_step.md) for details), and finally add "Join Component" node (Add > Bioxel Nodes > Component > Join Component), and connect them as shown below, with the parameters set as shown.
|
||||
|
||||

|
||||
|
||||
The "Join Component" node allows you to merge two components together. Move and rotate the Locater object so that the two components are exactly the same in position. If you're having trouble matching them up, here's the exact transform values to fill in the Locater object properties.
|
||||
|
||||

|
||||
|
||||
Next let's cutout the muscles individually.
|
||||
|
||||
First let's talk about the "Cutout by Hue" node. Literally, it cutout regions by hue of color. If you select this node and press "M" key to temporarily mute it, you'll see that the data becomes a cube with blue parts in Slice Viewer mode. the default value of Hue in the "Cutout by Hue" node is red, meaning that the node retains areas of the body that are close to red, and strip out the blue, which is on the opposite side of the red in the hue ring, leaving the human body parts.
|
||||
|
||||
If you turn down the value of Sensitivity, you'll see that the visabile part is decreasing, leaving only the part more closer to red, and the muscle happens to be red, so we can easily cutout the muscle. The color of the specimen tissue is not as vibrant as it is in the live state, and we can fine-tune the color to restore the vibrancy by using the "Set Color by Color" node (Add > Bioxel Nodes > Property > Set Color by Color).
|
||||
|
||||
To finally put it all together, connect and set the nodes as shown below, where the two colors in "Set Color by Ramp 2" node are `E7D2C5` and `FFEDEC`. If everything is working correctly, you'll get the rendering below.
|
||||
|
||||

|
||||
|
||||
You can also add "Transfrom" and "Cutter" nodes at the end and all components.
|
||||
|
||||

|
||||
|
||||
The multimodal data of VHP do not have any deformation or scaling differences, but only positional differences, so all data can be aligned easily. However, in most cases, the differences of different modalities are so great that they need to be registered first, which is not possible with Bioxel Nodes at the moment (but it is in plan). Nevertheless, you can build different components based on the same layer and combine them together. For example, based on the CT data, with the "Cutout by Range" node, you can eliminate the low value regions (fat), eliminate the high value regions (bone), and you can still get the muscle. And then attach it to the skull.
|
||||
|
||||

|
||||
|
||||
However, the CT values of brain and muscle are very close to each other, so it is extremely difficult to separate the brain from the muscle by threshold. So how should cutout the brain?
|
||||
|
||||
## Cutout the Brain
|
||||
|
||||
We can use AI technology to realize the division of brain regions, this process is called Segmentation, and the brain regions are as label. There are many models and methods for medical image segmentation, here we recommend [Total Segmentator](https://github.com/wasserth/TotalSegmentator).
|
||||
|
||||
It is an out-of-the-box CT/MRI medical image segmentation Python library. You can deploy Total Segmentator locally or process your data through the official online site [https://totalsegmentator.com](https://totalsegmentator.com).
|
||||
|
||||
Let me demonstrate the operation, we are still using the CT data from VHP. Click on "Drop DICOM.zip or ..." and select the VHP_M_CT_Head.zip file. Enter "brain" below "Selected task", press Enter to confirm. Finally click "Process data" button.
|
||||
|
||||

|
||||
|
||||
Wait for the uploading and processing, after all, you will be redirected to the following page, click "Download results" button, download and unzip segmentations.zip to any folder directory.
|
||||
|
||||

|
||||
|
||||
In case you can't get the brain segment (label), you can download it directly (without unzipping it).
|
||||
|
||||
[VHP_M_CT_Head_Brain.nii.gz](https://drive.google.com/file/d/1KGiZ3G11YLXkGszSrvWQ9kTF4TMpxUPd/view?usp=drive_link)
|
||||
|
||||
Next we import the brain segment (label) into the container in the same way as we imported the anatomical imagess(under the same container), but this time selecting **as Label**, with the Layer Name set to "Brain", and leaving the other options as default. Once the import is complete, a new "Fetch Layer" node will be added. Create and set the node as shown below, and you should be able to see the surface of brain.
|
||||
|
||||

|
||||
|
||||
Do you see the "step" like shape on surface? this is due to the low precision of the AI segmentation results. So How to addressing the issue? Select the Fetch Layer node of the brain label, right-click to pop up menu, click **Bioxel Nodes > Resample Value**, in the dialog box, change the "Smooth Size" to 3 or higher (the higher it is, the slower the calculation will be), click OK and wait for the calculation to finish. When it is done, a new layer will be added, replace the original one, is it smoother? The following figure lists different levels of smoothing.
|
||||
|
||||

|
||||
|
||||
The smoother it is, the more comfortable it looks, but it also means that more details are lost and the calculation is slower.
|
||||
|
||||
But if you cut the brain, you will find that the cross-section is homogeneous, this is because the label type layer is does not contain any modality data itself. Bioxel Nodes provides a function to fill in any layer values by label, if you set the value below brain tissue in the non-brain region of CT data, then any "Cutout" node will only keep the brain region.
|
||||
|
||||
The operation is like this, select the "Fetch Layer" node of the CT data, right-click to pop up the menu, click **Bioxel Nodes > Fill Value by Label**, in the dialog box, Label is set to the newly imported brain label layer, Fill Value is set to -100 (as long as it is less than the Hu value of the brain tissue), click OK. wait for the data processing, a new data layer will be added to the container when it is finished.
|
||||
|
||||
As shown in the following figure, connect the nodes and set the node parameters, in which the two colors of "Set Color by Ramp 2" node are `B26267` and `EBC5B7`, and the "Cutout by Range" and "Set Color by Ramp 2" node are changed to "Value" mode (the default is "Factor" mode), because the maximum and minimum values of the brain are too close to each other and difficult to adjust in "Factor" mode. To make the brain tissue look more transparent, I add the "Set Properties" (Add > Bioxel Nodes > Property > Set Properties) node at the end and changed the "Density" to 0.5.
|
||||
|
||||

|
||||
|
||||
(Still feel not smooth enough? It's really hard to get rid of "step" surface completely at the moment)
|
||||
|
||||
Now the brain is done. Finally we combine all together and you get something like the following.
|
||||
|
||||

|
||||
|
||||
🤗 If you've followed the docs up to this point, give yourself a round of applause, you've mastered this addon! If you have trouble following the docs instruction, you can download the project files to understand how the nodes work.
|
||||
|
||||
[VHP.zip](https://drive.google.com/file/d/1EHB7sxNSvJNwmoTfFnpyOSsm2M_2Y0hO/view?usp=sharing)
|
||||
|
||||
AI segmentation is an essential part of volumetric data visualization. Therefore, the future Bioxel Nodes will integrate some commonly used AI segmentation models, so that users can complete the volumetric data visualization in place!
|
||||
BIN
docs/assets/add-o-layer.png
LFS

BIN
docs/assets/adjust-nodes.png
LFS

BIN
docs/assets/advanced_usage/image-1.png
Normal file

|
After Width: | Height: | Size: 41 KiB |
BIN
docs/assets/advanced_usage/image-10.png
Normal file

|
After Width: | Height: | Size: 185 KiB |
BIN
docs/assets/advanced_usage/image-11.png
Normal file

|
After Width: | Height: | Size: 326 KiB |
BIN
docs/assets/advanced_usage/image-12.png
Normal file

|
After Width: | Height: | Size: 288 KiB |
BIN
docs/assets/advanced_usage/image-13.png
Normal file

|
After Width: | Height: | Size: 412 KiB |
BIN
docs/assets/advanced_usage/image-2.png
Normal file

|
After Width: | Height: | Size: 337 KiB |
BIN
docs/assets/advanced_usage/image-3.png
Normal file

|
After Width: | Height: | Size: 328 KiB |
BIN
docs/assets/advanced_usage/image-4.png
Normal file

|
After Width: | Height: | Size: 505 KiB |
BIN
docs/assets/advanced_usage/image-5.png
Normal file

|
After Width: | Height: | Size: 340 KiB |
BIN
docs/assets/advanced_usage/image-6.png
Normal file

|
After Width: | Height: | Size: 369 KiB |
BIN
docs/assets/advanced_usage/image-7.png
Normal file

|
After Width: | Height: | Size: 343 KiB |
BIN
docs/assets/advanced_usage/image-8.png
Normal file

|
After Width: | Height: | Size: 338 KiB |
BIN
docs/assets/advanced_usage/image-9.png
Normal file

|
After Width: | Height: | Size: 351 KiB |
BIN
docs/assets/advanced_usage/image.png
Normal file

|
After Width: | Height: | Size: 76 KiB |
BIN
docs/assets/connect-nodes.png
LFS

BIN
docs/assets/cut-small-parts.png
LFS

BIN
docs/assets/cut-structure.png
LFS

BIN
docs/assets/cut-to-region.png
LFS

BIN
docs/assets/import-data.png
LFS

BIN
docs/assets/improve_performance/image-1.png
Normal file

|
After Width: | Height: | Size: 1.3 MiB |
BIN
docs/assets/improve_performance/image-2.png
Normal file

|
After Width: | Height: | Size: 903 KiB |
BIN
docs/assets/improve_performance/image.png
Normal file

|
After Width: | Height: | Size: 126 KiB |
BIN
docs/assets/installation.png
LFS

BIN
docs/assets/installation/image.png
Normal file

|
After Width: | Height: | Size: 40 KiB |


BIN
docs/assets/scalar-to-color.png
LFS

BIN
docs/assets/set-color-by-pos.png
LFS

BIN
docs/assets/step_by_step/image-1.png
Normal file

|
After Width: | Height: | Size: 177 KiB |
BIN
docs/assets/step_by_step/image-2.png
Normal file

|
After Width: | Height: | Size: 278 KiB |
BIN
docs/assets/step_by_step/image-3.png
Normal file

|
After Width: | Height: | Size: 284 KiB |
BIN
docs/assets/step_by_step/image-4.png
Normal file

|
After Width: | Height: | Size: 311 KiB |
BIN
docs/assets/step_by_step/image-5.png
Normal file

|
After Width: | Height: | Size: 369 KiB |
BIN
docs/assets/step_by_step/image-6.png
Normal file

|
After Width: | Height: | Size: 350 KiB |
BIN
docs/assets/step_by_step/image-7.png
Normal file

|
After Width: | Height: | Size: 320 KiB |
BIN
docs/assets/step_by_step/image-8.png
Normal file

|
After Width: | Height: | Size: 314 KiB |
BIN
docs/assets/step_by_step/image-9.png
Normal file

|
After Width: | Height: | Size: 83 KiB |
BIN
docs/assets/step_by_step/image.png
Normal file

|
After Width: | Height: | Size: 86 KiB |
@@ -1,50 +0,0 @@
|
||||
# Bacsic Usage
|
||||
|
||||
## 1. Download Data
|
||||
|
||||
Download and unzip [VHP_M_CT_Head.zip](https://drive.google.com/file/d/1bBGpt5pQ0evr-0-f4KDNRnKPoUYj2bJ-/view?usp=drive_link) to a folder.
|
||||
The data comes from [Visible Human Project (VHP)](https://www.nlm.nih.gov/research/visible/visible_human.html), which is a CT scan image of a male head.
|
||||
|
||||
## 2. Import as "Layer"
|
||||
|
||||
Add a geometry node to the cube and open the geometry node interface sidebar. Switch to the Bioxel Nodes tab (1), click the Import Data button (2), and in the file selection dialog, choose any `.dcm` file from the data folder (3), then click the Import Data button (4).
|
||||
|
||||

|
||||
|
||||
Two dialogs will pop up in sequence, click OK for both. Wait for the data import (you can check the progress bar in the Blender interface status bar at the bottom right). After success, you will see a data preview in the Bioxel Nodes sidebar. Click the Add button at the bottom (1), move the mouse to the node panel, and place the **O Layer** node (2).
|
||||
|
||||

|
||||
|
||||
The data import is complete!
|
||||
|
||||
The data cache is saved as a link in the Blender file in the form of a "Layer", and the "Layer" is loaded into geometry nodes through the **O Layer** node. Their relationship is as follows:
|
||||
|
||||
Data Cache -> Layer -> O Layer
|
||||
|
||||
## 3. Extract and Render "Structure"
|
||||
|
||||
Operations on "Layer" are done through the O Bioxel series geometry nodes.
|
||||
|
||||
We need two additional nodes: **O Cutout by Threshold** and **O Realize Structure** nodes (both are in the node menu under Add > O Bioxel > Structure), and connect them as shown below:
|
||||
|
||||

|
||||
|
||||
If successful, you will see a gray head appear in the viewport. Now let's adjust the node parameters:
|
||||
|
||||
- **O Layer**: Check Center, uncheck Resample
|
||||
- **O Cutout by Threshold**: Set Threshold to 90
|
||||
- **O Realize Structure**: Set Density to 40, check Surface
|
||||
|
||||
Rotate the object, adjust the light position, set the renderer to Cycles, and the final effect is shown below:
|
||||
|
||||

|
||||
|
||||
Now we have completed the volumetric rendering of the head CT data!
|
||||
|
||||
Let's review the execution logic: First, cutout the "Structure" from the "Layer". As the name suggests, "Structure" is responsible for storing biological tissue structure, but its data type is volumetric and cannot be seen directly. It requires **O Realize Structure** to present the "Structure".
|
||||
|
||||
## 4. Save Data Cache (Optional)
|
||||
|
||||
Since the data cache is only saved as a link in the Blender file, passing only the Blender file to other devices will cause the "Layer" to lose its cache. Click the Save button in the Bioxel Nodes tab, and select a location to save the data cache to manage the cache resource.
|
||||
|
||||
Just like images, when sharing, send both the data cache and the Blender file together.
|
||||
@@ -1,51 +0,0 @@
|
||||
# 入门
|
||||
|
||||
## 1. 下载数据
|
||||
|
||||
下载并解压到文件夹中 [VHP_M_CT_Head.zip](https://drive.google.com/file/d/1bBGpt5pQ0evr-0-f4KDNRnKPoUYj2bJ-/view?usp=drive_link)
|
||||
数据来自 [Visible Human Project (VHP)](https://www.nlm.nih.gov/research/visible/visible_human.html)这是一个男性头部的 CT 扫描图像
|
||||
|
||||
## 2. 导入为「数据层」
|
||||
|
||||
给立方体添加几何节点,并打开几何节点界面侧边栏。切换到 Bioxel Nodes 分页(1),点击 Import Data 按钮(2),在文件选择对话框中,选择数据文件夹中任意一个`.dcm`文件(3),点击 Import Data 按钮(4)
|
||||
|
||||

|
||||
|
||||
依次会弹出两个对话框,都点击 OK 按钮,等待数据导入(可查看 Blender 界面右下角状态栏的进度条)成功后可以看到 Bioxel Nodes 侧边栏多了数据预览画面。点击下方的 Add 按钮(1),鼠标移动到节点面板,放置 **O Layer** 节点(2)
|
||||
|
||||

|
||||
|
||||
数据的导入就完成啦👍
|
||||
|
||||
数据缓存在主目录里,以「数据层(Layer)」形式添加在 Blender 文件中,「数据层」通过 **O Layer** 节点装载到几何节点。它们的关系如下:
|
||||
|
||||
数据缓存 -> 数据层 -> O Layer
|
||||
|
||||
|
||||
## 3. 提取并渲染「结构体」
|
||||
|
||||
对「数据层」的操作通过 O Bioxel 系列几何节点完成。
|
||||
|
||||
我们需要额外两个节点,**O Cutout by Threshold** 和 **O Realize Structure** 节点(它们都在节点菜单,Add > O Bioxel > Structure 下),并按下图连接:
|
||||
|
||||

|
||||
|
||||
如果成功,可以看到视图中出现了灰色的头部。接下来我们调整节点参数:
|
||||
|
||||
- **O Layer**:勾选 Center,取消 Resample
|
||||
- **O Cutout by Threshold**:Threshold 设置为 90
|
||||
- **O Realize Structure**:Density 设置为 40,勾选 Surface
|
||||
|
||||
调整物体转向、灯位置,设置渲染器为 Cycles,最终效果如下图:
|
||||
|
||||

|
||||
|
||||
这样我们就完成了头部 CT 数据的体积渲染👍
|
||||
|
||||
简单捋一下执行逻辑,「数据层」先被剪出(Cutout)为「结构体」。「结构体」顾名思义就是负责储存生物组织结构的对象,但它本身数据类型是体积,并不能直接被看到。需要 **O Realize Structure** 来呈现「结构体」
|
||||
|
||||
## 4. 另存数据缓存(可选)
|
||||
|
||||
由于数据缓存只是以链接形式保存在 Blender 文件中,所以只传递 Blender 文件给其他设备,会导致「数据层」遗失缓存。点击 Bioxel Nodes 分页中 Save 按钮,选择数据缓存的另存位置来管理缓存资源。
|
||||
|
||||
就像图片一样,传递时把数据缓存和 Blender 文件一起发送。
|
||||
@@ -1,39 +0,0 @@
|
||||
# 支持的格式
|
||||
|
||||
迫不及待想使用自己的数据来体验插件了?以下是当前支持的格式列表。
|
||||
|
||||
| 格式 | 扩展名 |
|
||||
| ------ | ---------------------------------------- |
|
||||
| DICOM | .dcm, .DCM, .DICOM, .ima, .IMA |
|
||||
| BMP | .bmp, .BMP |
|
||||
| JPEG | .jpg, .JPG, .jpeg, .JPEG |
|
||||
| PNG | .png, .PNG |
|
||||
| TIFF | .tif, .TIF, .tiff, .TIFF |
|
||||
| Nifti | .nia, .nii, .nii.gz, .hdr, .img, .img.gz |
|
||||
| Nrrd | .nrrd, .nhdr |
|
||||
| HDF5 | .hdf, .h4, .hdf4, .he2, .h5, .hdf5, .he5 |
|
||||
| OME | .ome.tiff, .ome.tif |
|
||||
| MRC | .mrc, .mrc.gz, .map, .map.gz |
|
||||
|
||||
尽管我尽了最大努力,仍然无法实现对所有体数据格式的完美支持,我将持续努力改进。
|
||||
|
||||
## 公开数据库
|
||||
|
||||
如果您没有体数据,可以从一些公开数据库下载。
|
||||
|
||||
**请注意,虽然它们是公开的且可供下载,但并不意味着您可以将其用于任何目的!请务必查看网站上的可用范围说明。**
|
||||
|
||||
| 来源 | 对象 |
|
||||
| ------------------------------------------------------------------------------------ | ------------------ |
|
||||
| [MorphoSource](https://www.morphosource.org/) | 开放研究数据 |
|
||||
| [Dryad](https://datadryad.org) | 开放研究数据 |
|
||||
| [Cell Image Library](http://cellimagelibrary.org/home) | 细胞 |
|
||||
| [OpenOrganelle](https://openorganelle.janelia.org/datasets) | 细胞 |
|
||||
| [Allen Cell Explorer](https://www.allencell.org/3d-cell-viewer.html) | 细胞 |
|
||||
| [EMDB](https://www.ebi.ac.uk/emdb/) | 蛋白质、病毒 |
|
||||
| [IDC](https://portal.imaging.datacommons.cancer.gov/explore/) | 医学图像 |
|
||||
| [Embodi3D](https://www.embodi3d.com/files/category/37-medical-scans/) | 医学图像 |
|
||||
| [Github](https://github.com/sfikas/medical-imaging-datasets) | 医学图像 |
|
||||
| [NIHR](https://nhsx.github.io/open-source-imaging-data-sets/) | 医学图像 |
|
||||
| [Medical Segmentation Decathlon](http://medicaldecathlon.com/) | 医学图像 |
|
||||
| [Visible Human Project](https://www.nih.gov/research/visible/visible_human.html) | 医学图像 |
|
||||
@@ -1,15 +0,0 @@
|
||||
# FAQ
|
||||
|
||||
## Nothing in the scene when rendering?
|
||||
|
||||
If you're using the Cycles renderer with GPU, make sure your GPU supports "Optix", as Bioxel Nodes relies on OSL (Open shader language) for volumetric rendering, otherwise you'll have to use the CPU for rendering.
|
||||
|
||||
If you're using the EEVEE renderer, this issue is due to EEVEE not loading shaders for some unknown reason, save the file and restart Blender to fix it.
|
||||
|
||||
## After updating the addon, the nodes in the file have turned red?
|
||||
|
||||
This is because the version of the nodes in the file does not match the current version of the addon after updating.
|
||||
|
||||
If you still want to edit the file with Bioxel Nodes, you can only roll back the addon version to the version that corresponds to the nodes.
|
||||
|
||||
If you just want the file to work and you won't rely on Bioxel Nodes any more, then you can just click **Bioxel Nodes > Relink Node Library >** in the top menu and select the corresponding version. Check to see if the nodes are working and rendering properly, and when everything is OK, click **Bioxel Nodes > Save Node Library** and select the save location in the dialog box.
|
||||
16
docs/faq.md
@@ -1,15 +1,15 @@
|
||||
# 常见问题
|
||||
# FAQ
|
||||
|
||||
## 渲染时场景什么都没有?
|
||||
## Nothing in the scene when rendering?
|
||||
|
||||
如果您使用 GPU 进行 Cycles 渲染,请确保您的 GPU 支持"Optix",因为 Bioxel Nodes 依赖 OSL(Open Shader Language)进行体渲染,否则您必须使用 CPU 进行渲染。
|
||||
If you're using the Cycles renderer with GPU, make sure your GPU supports "Optix", as Bioxel Nodes relies on OSL (Open shader language) for volumetric rendering, otherwise you'll have to use the CPU for rendering.
|
||||
|
||||
如果您使用 EEVEE 渲染器,此问题是因为 EEVEE 出于未知原因未加载着色器,保存文件并重启 Blender 即可修复。
|
||||
If you're using the EEVEE renderer, this issue is due to EEVEE not loading shaders for some unknown reason, save the file and restart Blender to fix it.
|
||||
|
||||
## 更新插件后,文件中的节点变红了?
|
||||
## After updating the addon, the nodes in the file have turned red?
|
||||
|
||||
这是因为文件中节点的版本与更新后插件的版本不匹配。
|
||||
This is because the version of the nodes in the file does not match the current version of the addon after updating.
|
||||
|
||||
如果您仍想使用 Bioxel Nodes 编辑文件,只能将插件回滚到与节点对应的版本。
|
||||
If you still want to edit the file with Bioxel Nodes, you can only roll back the addon version to the version that corresponds to the nodes.
|
||||
|
||||
如果您只想让文件正常工作,不再依赖 Bioxel Nodes,那么您只需点击顶部菜单 **Bioxel Nodes > Relink Node Library >**,然后选择相应的版本。检查节点是否正常工作并正确渲染,一切正常后,点击 **Bioxel Nodes > Save Node Library**,在对话框中选择保存位置。
|
||||
If you just want the file to work and you won't rely on Bioxel Nodes any more, then you can just click **Bioxel Nodes > Relink Node Library >** in the top menu and select the corresponding version. Check to see if the nodes are working and rendering properly, and when everything is OK, click **Bioxel Nodes > Save Node Library** and select the save location in the dialog box.
|
||||
|
||||
39
docs/improve_performance.md
Normal file
@@ -0,0 +1,39 @@
|
||||
# Improve Performance
|
||||
|
||||
Volume reconstruction and volume rendering are very consuming computation, I believe that this add-on's experience is terrible on poorly hardware. here are tips to improve the add-on performance.
|
||||
|
||||
## Use Low-Res Data as Preview
|
||||
|
||||
The addon provides data resample function, the operation is as follows. First, in the container's geometry node, select the layer you need to resample, right-click **Bioxel Nodes > Resample Value**, in the dialog box, change the "Bioxel Size" value to twice or more than the current value, click OK. the addon will create a low-res version of the layer and load it into the container's geometry node.
|
||||
|
||||

|
||||
|
||||
You can see that the speed of the reconstruction has been reduced from 240 ms to 37 ms, making it possible to compute in almost real-time, and improving the speed of the feedback of the changing the parameters. Once you are satisfied with the adjustment, you can then connect the original layer to the nodes. This tip can greatly improve the operation experience of the node.
|
||||
|
||||
## Raise the Step Rate of a Container
|
||||
|
||||
Step rate is a key setting in volume rendering. The higher the step rate, the faster the rendering will be, but at the same time, the thinner the volume will look. If you want to have a very thin effect, or if you don't need to cut through component, you can always set the step rate high, you can adjust step rate in the render settings globaly. However, I recommend you to adjust the step rate of the container separately, so that it doesn't affect the rendering of the other volume in the Blender file, do as follows.
|
||||
|
||||
In the container's geometry nodes panel menu, click **Bioxel Nodes > Change Container Properties**, in the dialog box, raise the "Step Rate" value (up to 100) and click OK.
|
||||
|
||||

|
||||
|
||||
You can see that the rendering speed is much higher, but at the same time the cuts look blurry and transparent.
|
||||
|
||||
## Balance rendering settings
|
||||
|
||||
I list some of the settings that affect the volume rendering most, so you can find the most balanced settings for your needs.
|
||||
|
||||
- **Light Paths > Max Bounces > Volume** affects the number of bounces a volume has, the higher the value, the more transparent it will look.
|
||||
|
||||
- **Light Paths > Max Bounces > Transparent** affects the number of times transparent surfaces are transmitted, the higher the value, the more transparent it will look.
|
||||
|
||||
- **Volumes > Step Rate Render | Viewport** affects the volume rendering step, the smaller the value, the more detailed the volume will look
|
||||
|
||||
Bioxel Nodes provides some render setting presets for quick setup. In the top menu, click **Bioxel Nodes > Render Setting Presets**, including Performance (left), Balance (center), and Quality (right). Here is a comparison of them.
|
||||
|
||||

|
||||
|
||||
## Rendering with EEVEE
|
||||
|
||||
EEVEE doesn't render volume as well as Cycles, but it does have the advantage of rendering the volumetric data, and is even a better choice if you want to get a clear view of slice. And EEVEE's real-time rendering make it possible to create interactive stuff in Blender.
|
||||
@@ -1,59 +0,0 @@
|
||||
**v2.0.x has been released, supporting only Blender 5.0+. The usage is completely different from before and is not compatible with old version files. See http://docs.omoolab.xyz/bioxelnodes/2.0.x/en/basics/**
|
||||
|
||||
# Bioxel Nodes
|
||||
|
||||
[](https://blender.org/)
|
||||

|
||||

|
||||

|
||||
|
||||
[](https://discord.gg/pYkNyq2TjE)
|
||||
|
||||
Bioxel Nodes is a Blender addon for scientific volumetric data visualization. It using Blender's powerful **Geometry Nodes** and **Cycles** to process and render volumetric data.
|
||||
|
||||
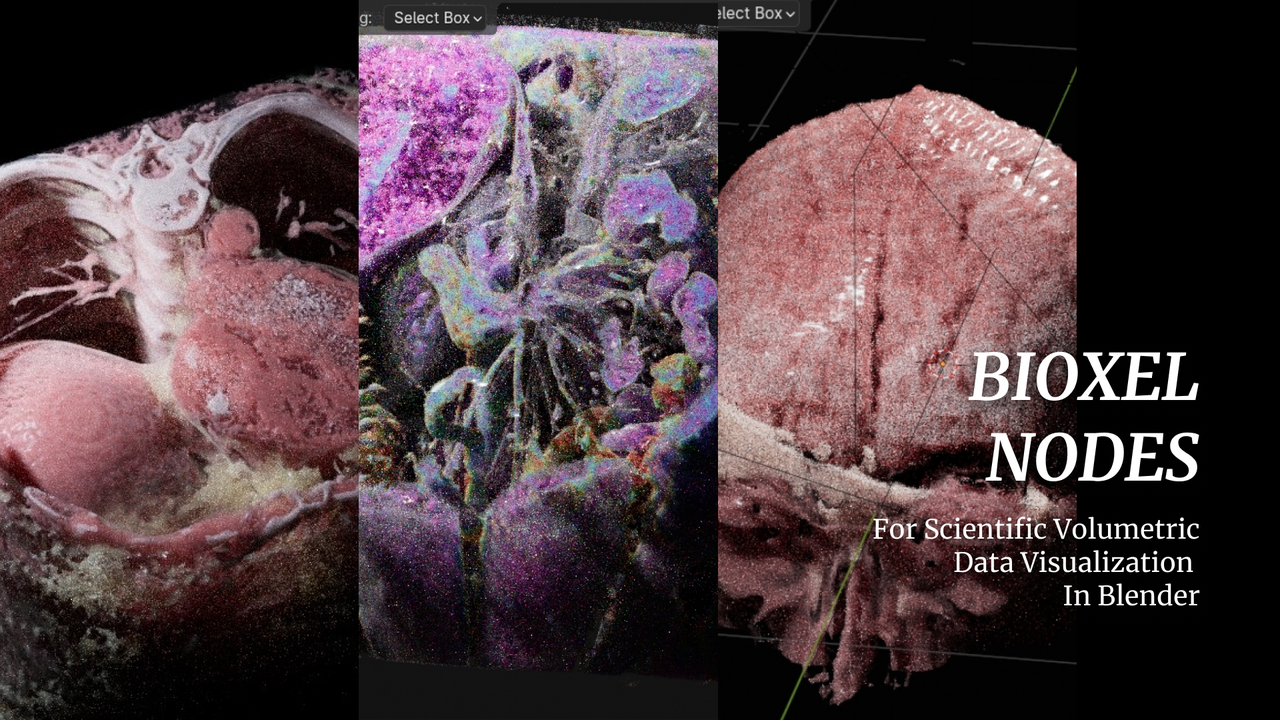
|
||||
|
||||
- Realistic rendering result, also support EEVEE NEXT.
|
||||
- Support multiple formats.
|
||||
- Support 4D volumetric data.
|
||||
- All kinds of cutters.
|
||||
- Simple and powerful nodes.
|
||||
- Based on blender natively, can work without addon.
|
||||
|
||||
**Read the [getting started](https://docs.omoolab.xyz/bioxelnodes/latest/en/installation) to begin your journey into visualizing volumetric data!**
|
||||
|
||||
Welcome to our [discord server](https://discord.gg/pYkNyq2TjE), if you have any problems with this add-on.
|
||||
|
||||
## Support Multiple Formats
|
||||
|
||||
| Format | EXT |
|
||||
| ------ | ---------------------------------------- |
|
||||
| DICOM | .dcm, .DCM, .DICOM, .ima, .IMA |
|
||||
| BMP | .bmp, .BMP |
|
||||
| JPEG | .jpg, .JPG, .jpeg, .JPEG |
|
||||
| PNG | .png, .PNG |
|
||||
| TIFF | .tif, .TIF, .tiff, .TIFF |
|
||||
| Nifti | .nia, .nii, .nii.gz, .hdr, .img, .img.gz |
|
||||
| Nrrd | .nrrd, .nhdr |
|
||||
| HDF5 | .hdf, .h4, .hdf4, .he2, .h5, .hdf5, .he5 |
|
||||
| OME | .ome.tiff, .ome.tif |
|
||||
| MRC | .mrc, .mrc.gz, .map, .map.gz |
|
||||
|
||||
## Support 4D volumetric data
|
||||
|
||||
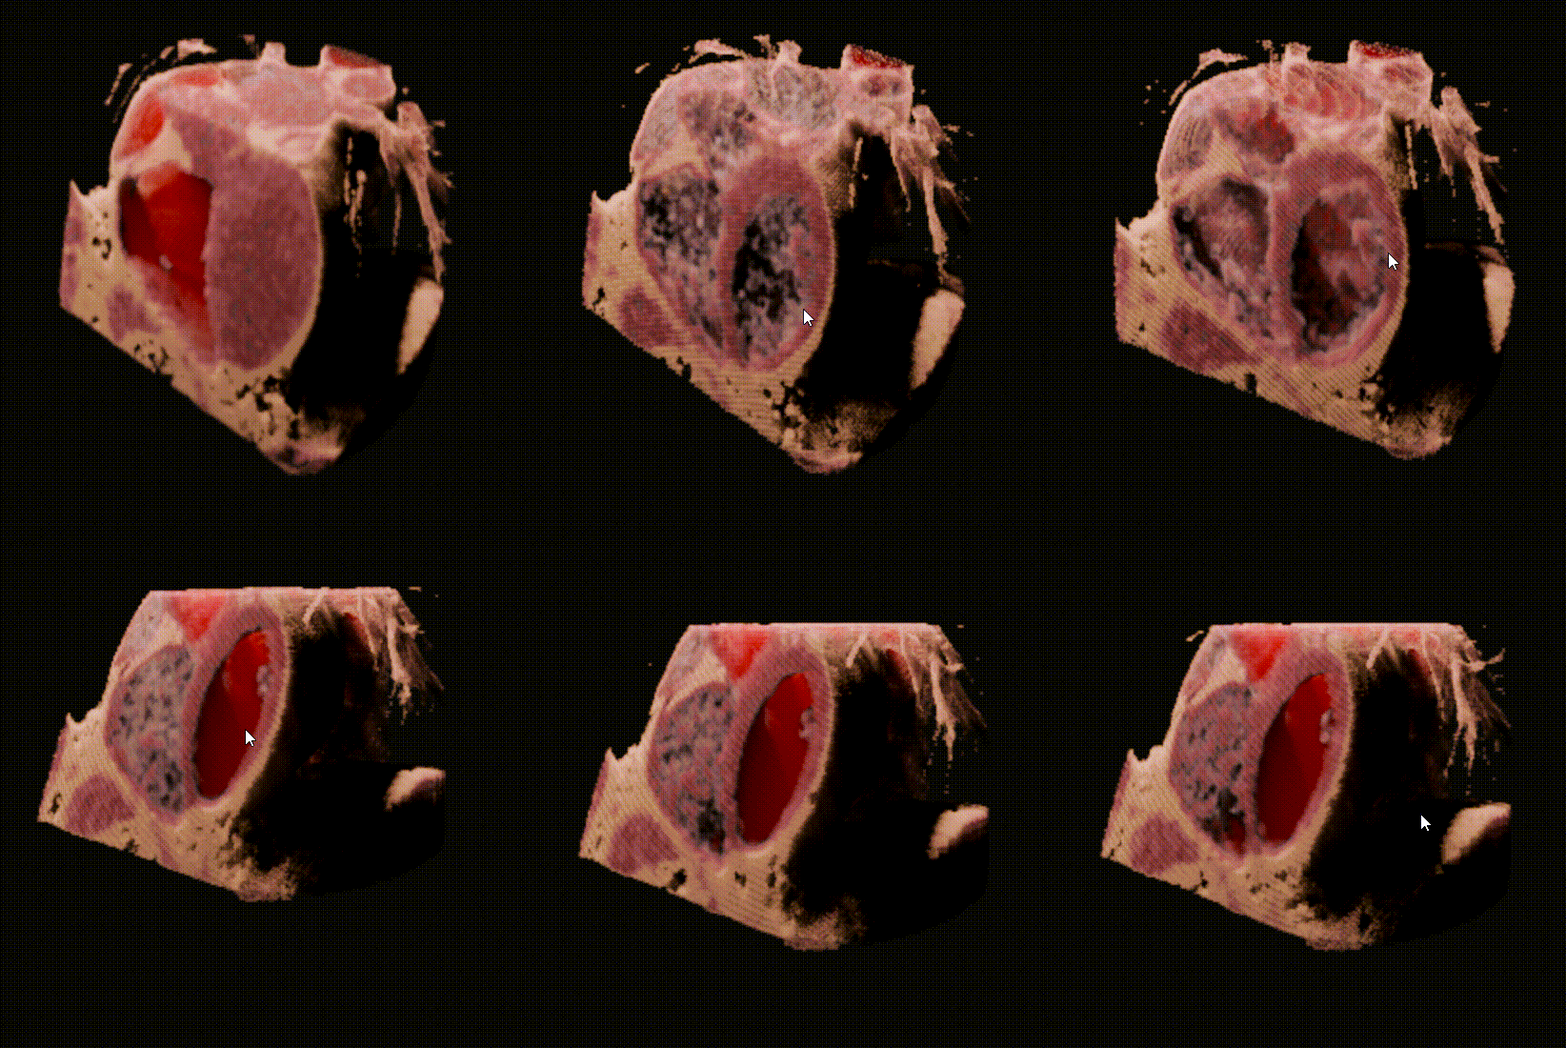
|
||||
|
||||
🥰 4D volumetric data can also be imported into Blender.
|
||||
|
||||
## Support EEVEE NEXT
|
||||
|
||||
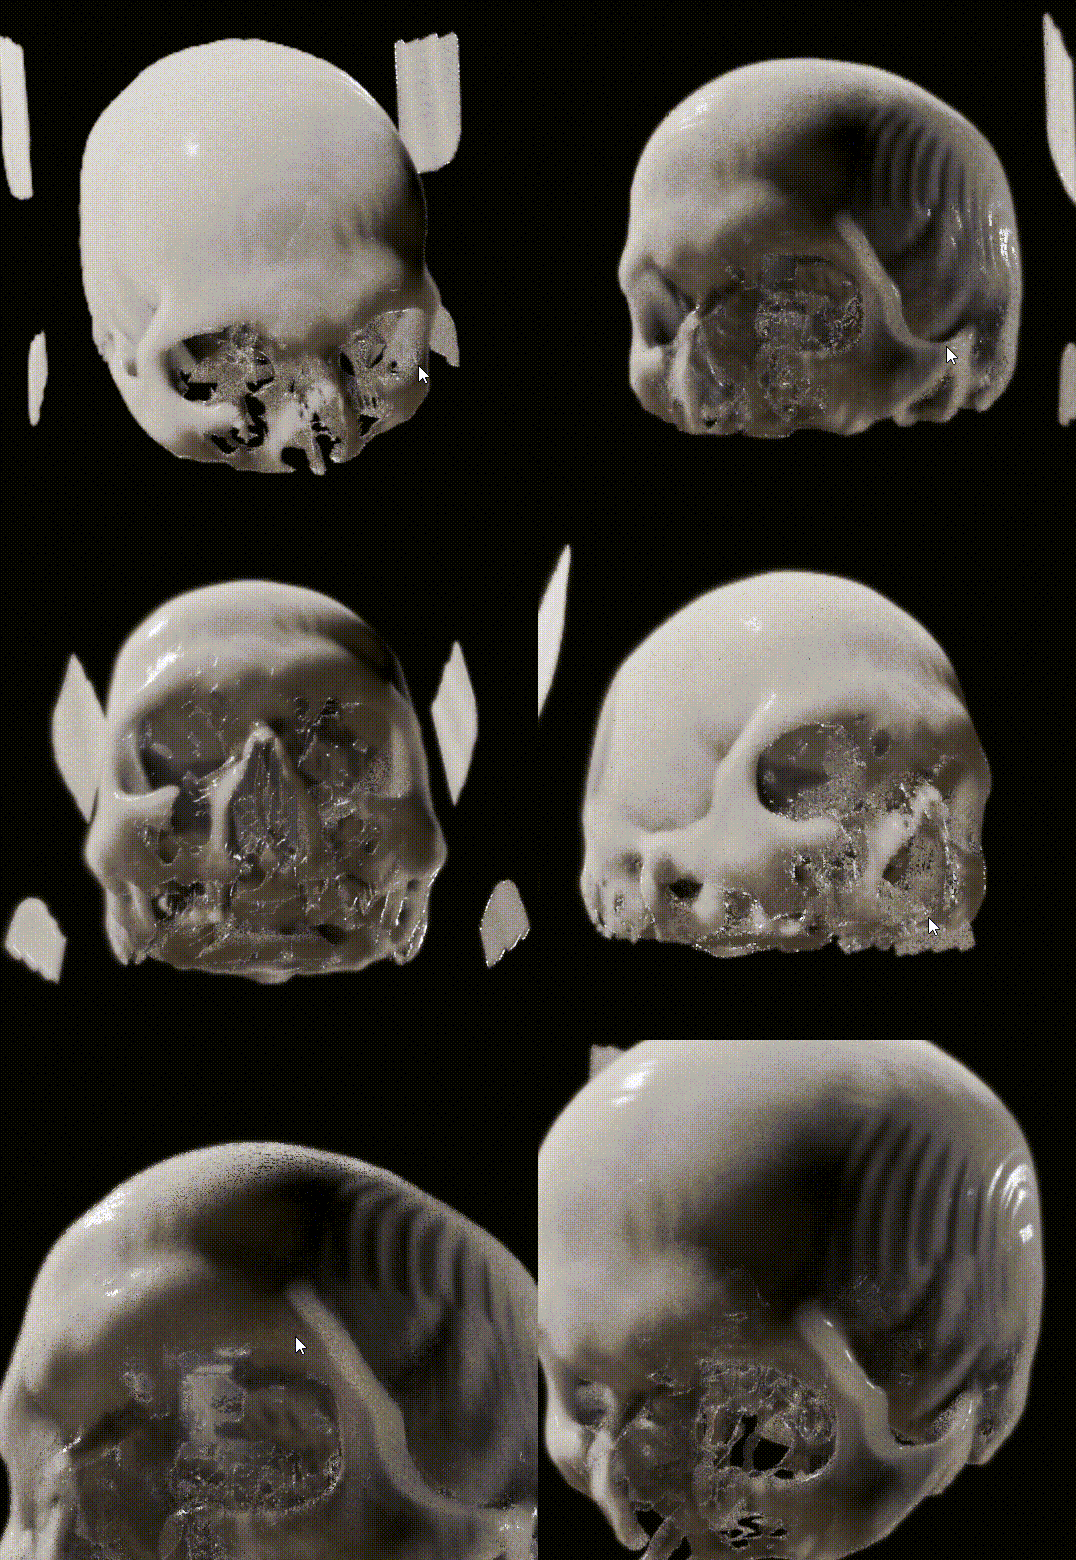
|
||||
|
||||
👍 EEVEE NEXT is absolutely AWESOME! Bioxel Nodes is fully support EEVEE NEXT now!
|
||||
|
||||
|
||||
## Roadmap
|
||||
|
||||
- Better multi-format import experience
|
||||
- One-click bake model with texture
|
||||
- AI Segmentation to Generate Labels
|
||||
@@ -1,4 +1,4 @@
|
||||
**v2.0.X 已发布,仅支持 Blender 5.0+,使用方式和之前截然不同,也无法兼容旧版本文件。使用方式查看 http://docs.omoolab.xyz/bioxelnodes/2.0.x/basics/**
|
||||
[中文文档](https://uj6xfhbzp0.feishu.cn/wiki/LPKEwjooSivxjskWHlCcQznjnNf?from=from_copylink)
|
||||
|
||||
# Bioxel Nodes
|
||||
|
||||
@@ -9,50 +9,58 @@
|
||||
|
||||
[](https://discord.gg/pYkNyq2TjE)
|
||||
|
||||
Bioxel Nodes 是一款用于科学体数据可视化的 Blender 插件。它利用 Blender 强大的 **几何节点 (Geometry Nodes)** 和 **Cycles** 渲染器来处理和渲染体数据。
|
||||
Bioxel Nodes is a Blender addon for scientific volumetric data visualization. It using Blender's powerful **Geometry Nodes** and **Cycles** to process and render volumetric data.
|
||||
|
||||

|
||||
|
||||
- 逼真的渲染效果,同时也支持 EEVEE NEXT
|
||||
- 支持多种数据格式
|
||||
- 支持 4D 体数据
|
||||
- 多种切割工具
|
||||
- 简洁而强大的节点系统
|
||||
- 基于 Blender 原生开发,插件卸载后仍可正常工作
|
||||
- Realistic rendering result, also support EEVEE NEXT.
|
||||
- Support multiple formats.
|
||||
- Support 4D volumetric data.
|
||||
- All kinds of cutters.
|
||||
- Simple and powerful nodes.
|
||||
- Based on blender natively, can work without addon.
|
||||
|
||||
**阅读[安装指南](installation.md)开始您的体数据可视化之旅!**
|
||||
**Read the [getting started](https://omoolab.github.io/BioxelNodes/latest/installation) to begin your journey into visualizing volumetric data!**
|
||||
|
||||
如果您在使用过程中遇到任何问题,欢迎加入我们的 [Discord 服务器](https://discord.gg/pYkNyq2TjE)。
|
||||
Welcome to our [discord server](https://discord.gg/pYkNyq2TjE), if you have any problems with this add-on.
|
||||
|
||||
## 支持多种格式
|
||||
## Support Multiple Formats
|
||||
|
||||
| 格式 | 扩展名 |
|
||||
| ----- | ---------------------------------------- |
|
||||
| DICOM | .dcm, .DCM, .DICOM, .ima, .IMA |
|
||||
| BMP | .bmp, .BMP |
|
||||
| JPEG | .jpg, .JPG, .jpeg, .JPEG |
|
||||
| PNG | .png, .PNG |
|
||||
| TIFF | .tif, .TIF, .tiff, .TIFF |
|
||||
| Nifti | .nia, .nii, .nii.gz, .hdr, .img, .img.gz |
|
||||
| Nrrd | .nrrd, .nhdr |
|
||||
| HDF5 | .hdf, .h4, .hdf4, .he2, .h5, .hdf5, .he5 |
|
||||
| OME | .ome.tiff, .ome.tif |
|
||||
| MRC | .mrc, .mrc.gz, .map, .map.gz |
|
||||
| Format | EXT |
|
||||
| ------ | ---------------------------------------- |
|
||||
| DICOM | .dcm, .DCM, .DICOM, .ima, .IMA |
|
||||
| BMP | .bmp, .BMP |
|
||||
| JPEG | .jpg, .JPG, .jpeg, .JPEG |
|
||||
| PNG | .png, .PNG |
|
||||
| TIFF | .tif, .TIF, .tiff, .TIFF |
|
||||
| Nifti | .nia, .nii, .nii.gz, .hdr, .img, .img.gz |
|
||||
| Nrrd | .nrrd, .nhdr |
|
||||
| HDF5 | .hdf, .h4, .hdf4, .he2, .h5, .hdf5, .he5 |
|
||||
| OME | .ome.tiff, .ome.tif |
|
||||
| MRC | .mrc, .mrc.gz, .map, .map.gz |
|
||||
|
||||
## 支持 4D 体数据
|
||||
## Support 4D volumetric data
|
||||
|
||||

|
||||
|
||||
4D 体数据也可以导入到 Blender 中。
|
||||
🥰 4D volumetric data can also be imported into Blender.
|
||||
|
||||
## 支持 EEVEE NEXT
|
||||
## Support EEVEE NEXT
|
||||
|
||||

|
||||
|
||||
EEVEE NEXT 太棒了!Bioxel Nodes 现在全面支持 EEVEE NEXT!
|
||||
👍 EEVEE NEXT is absolutely AWESOME! Bioxel Nodes is fully support EEVEE NEXT now! However, there are some limitations:
|
||||
|
||||
## 路线图
|
||||
1. Only one cutter supported.
|
||||
2. EEVEE result is not that great as Cycles does.
|
||||
|
||||
- 更完善的多格式导入体验
|
||||
- 一键烘焙带纹理模型
|
||||
- AI 分割生成标签
|
||||
## Known Limitations
|
||||
|
||||
- Only works with Cycles CPU , Cycles GPU (OptiX), EEVEE
|
||||
- Section surface cannot be generated when convert to mesh (will be supported soon)
|
||||
|
||||
## Roadmap
|
||||
|
||||
- Better multi-format import experience
|
||||
- One-click bake model with texture
|
||||
- AI Segmentation to Generate Labels
|
||||
|
||||
@@ -1,22 +0,0 @@
|
||||
# Installation
|
||||
|
||||
!!! warning
|
||||
**v2.0.x only supports Blender 5.0 and above**
|
||||
|
||||
The add-on supports multiple installation methods, choose one.
|
||||
|
||||
## Blender Preferences (Recommended)
|
||||
|
||||
Click the top menu **Edit > Preferences**, search for "biox" in the "Get Extensions" area. Then click Install. Due to the large add-on size (60~100MB), you may need to wait for a while.
|
||||
|
||||

|
||||
|
||||
## Blender Official Extensions Website
|
||||
|
||||
Visit [https://extensions.blender.org/add-ons/bioxelnodes/](https://extensions.blender.org/add-ons/bioxelnodes/)
|
||||
Click Get Add-on, open Blender, drag the add-on into Blender and follow the prompts to install.
|
||||
|
||||
## Manual Installation
|
||||
|
||||
You can also download `BioxelNodes.{version}.zip` from [here](https://github.com/OmooLab/BioxelNodes/releases/latest) for manual installation.
|
||||
Click the top menu **Edit > Preferences**, select **Add-ons > Install from Disk**, then choose the Zip file you downloaded.
|
||||
@@ -1,22 +1,19 @@
|
||||
# 安装
|
||||
# Installation
|
||||
|
||||
!!! warning
|
||||
**v2.0.x 仅支持 Blender 5.0 及以上版本**
|
||||
**Currently only support Blender 4.2 or above, make sure you have the correct version of Blender.**
|
||||
|
||||
插件支持多种安装方式,选其中之一即可
|
||||
## Install in Blender (recommended)
|
||||
|
||||
## Blender 偏好设置(推荐)
|
||||
This is the most recommended way, in the top menu, click **Edit > Preferences**, in "Get Extensions" Section, enter "bio" in the search box, then click Install. due to the add-on size (25MB~50MB) you may need to wait a while.
|
||||
|
||||
点击顶部菜单 **Edit > Preferences**,在 "Get Extensions" 区域搜索 "biox"。然后点击 Install。由于插件体积较大(60~100MB),可能需要等待一段时间。
|
||||

|
||||
|
||||

|
||||
## Blender Official Extensions Website
|
||||
|
||||
## Blender 官方扩展网站
|
||||
Or you can visit the Blender official extensions website at [https://extensions.blender.org/add-ons/bioxelnodes/](https://extensions.blender.org/add-ons/bioxelnodes/)
|
||||
Click Get Add-on, open Blender, drag in Blender and follow the instructions to install.
|
||||
|
||||
访问 [https://extensions.blender.org/add-ons/bioxelnodes/](https://extensions.blender.org/add-ons/bioxelnodes/)
|
||||
点击 Get Add-on,打开 Blender,将插件拖入并按照提示安装。
|
||||
## Manual Install
|
||||
|
||||
## 手动安装
|
||||
|
||||
您也可以从 [这里](https://github.com/OmooLab/BioxelNodes/releases/latest) 下载 `BioxelNodes.{version}.zip` 进行手动安装。
|
||||
点击顶部菜单 **Edit > Preferences**,选择 **Add-ons > Install from Disk**,然后选择您下载的 Zip 文件。
|
||||
You can also install _BioxelNodes\_{version}.zip_ manually by downloading from [bere](https://github.com/OmooLab/BioxelNodes/releases/latest).
|
||||
In the top menu, click **Edit > Preferences**, **Add-ons > Install from Disk** and select the Zip file you just downloaded.
|
||||
|
||||
@@ -1,25 +0,0 @@
|
||||
# Improve Performance
|
||||
|
||||
Voxel reconstruction and voxel rendering are very computation-intensive. Here are some tips to improve the add-on's performance.
|
||||
|
||||
## Use Low-Resolution Data as Preview
|
||||
|
||||
The resolution of voxels geometrically affects computational efficiency. Enabling Resample on O Layer can greatly improve calculation speed. You can uncheck it when you need to render for real. The Layer Nodes panel in the Bioxel Nodes tab lists all O Layers added in the current geometry nodes. You can uniformly manage whether Resample is enabled and the degree of resampling.
|
||||
|
||||
## Balanced Rendering Settings
|
||||
|
||||
I list some settings that have the greatest impact on volume rendering, so you can find the most suitable balance for your needs.
|
||||
|
||||
- **Light Paths > Max Bounces > Volume** affects the number of bounces for volume data. The higher the value, the more transparent the volume data appears.
|
||||
|
||||
- **Light Paths > Max Bounces > Transparent** affects the number of times transparent surfaces are transmitted. The higher the value, the more transparent the transparent surfaces appear.
|
||||
|
||||
- **Volumes > Step Rate Render | Viewport** affects the step size of volume rendering. The smaller the value, the more detailed the volume data appears.
|
||||
|
||||
Bioxel Nodes provides some render setting presets for quick configuration. Click the top menu **Bioxel Nodes > Render Setting Presets**, including Performance (left), Balance (center), and Quality (right). Here is a comparison:
|
||||
|
||||

|
||||
|
||||
## Rendering with EEVEE
|
||||
|
||||
EEVEE doesn't render volume as well as Cycles, but it does have the advantage of rendering volumetric data. If you want to get a clear slice view, it is even a better choice. EEVEE's real-time rendering makes it possible to create interactive content in Blender.
|
||||
@@ -1,25 +0,0 @@
|
||||
# 提升性能
|
||||
|
||||
体素重建和体素渲染是非常消耗计算资源的,以下是一些提升插件性能的建议。
|
||||
|
||||
## 使用低分辨率数据作为预览
|
||||
|
||||
体素的分辨率几何倍地影响计算效率,O Layer 的 Resample 开启可以大大提高计算速度。当你需要正式渲染的时候再关闭即可。在 Bioxel Nodes 分页的 Layer Nodes 面板罗列了当前几何节点中添加的所有 O Layer,你可以统一管理是否开启 Resample,以及程度。
|
||||
|
||||
## 平衡的渲染设置
|
||||
|
||||
我列出了一些对体渲染影响最大的设置,以便您找到最适合自己的平衡点。
|
||||
|
||||
- **Light Paths > Max Bounces > Volume** 影响体数据的反弹次数,值越高,体数据看起来越透明。
|
||||
|
||||
- **Light Paths > Max Bounces > Transparent** 影响透明表面透射的次数,值越高,透明表面看起来越透明。
|
||||
|
||||
- **Volumes > Step Rate Render | Viewport** 影响体渲染的步长,值越小,体数据看起来越精细。
|
||||
|
||||
Bioxel Nodes 提供了一些渲染设置预设以便快速配置。点击顶部菜单 **Bioxel Nodes > Render Setting Presets**,包括 Performance(左侧)、Balance(中间)和 Quality(右侧)。以下是它们的比较。
|
||||
|
||||

|
||||
|
||||
## 使用 EEVEE 渲染
|
||||
|
||||
EEVEE 渲染体数据不如 Cycles,但它确实有渲染体数据的优势,如果您想获得清晰的切片视图,它甚至是更好的选择。EEVEE 的实时渲染使得在 Blender 中创建交互式内容成为可能。
|
||||
97
docs/step_by_step.md
Normal file
@@ -0,0 +1,97 @@
|
||||
# Step by Step
|
||||
|
||||
## Download Data
|
||||
|
||||
Here is the open data from [Visible Human Project (VHP)](https://www.nlm.nih.gov/research/visible/visible_human.html) for you to learn how to use this addon. It is a CT scan image of a male head, download and unzip it to a new directry for later usage.
|
||||
|
||||
[VHP_M_CT_Head.zip](https://drive.google.com/file/d/1bBGpt5pQ0evr-0-f4KDNRnKPoUYj2bJ-/view?usp=drive_link)
|
||||
|
||||
VHP original radiology data was shared in the proprietary format that predated DICOM, complicating its use. Now all data has been harmonized to standard DICOM and released in [NCI Imaging Data Commons (IDC)](https://portal.imaging.datacommons.cancer.gov/), you also can download data from IDC by yourself.
|
||||
|
||||
## Import Data
|
||||
|
||||
In the top menu, click **Bioxel Nodes > Import Volumetric Data (Init) > as Scalar**, locate to the unzipped folder, select any DICOM file (don't select more than one, and don't select the folder either), and click **Import as Scalar**.
|
||||
|
||||

|
||||
|
||||
You can also choose to import data by dragging one DICOM file into the 3D viewport (some DICOM files don't have extension suffix and can't be dragged in).
|
||||
|
||||
The process of reading the data may take a while, the bottom right corner of the Blender interface will show you the progress of the reading, and a dialog box will pop up when the reading is successful. Ignore all the options for now and just click OK, I will explain the purpose of these options later.
|
||||
|
||||
The import process involves data conversion, so there is more waiting time, and the progress of the import is displayed in the lower right corner of the interface. After importing, the addon will create a new object, with a new geometry nodes that will serve as a "workbench" for manipulating the data, the new object is called the **Container**. The newly imported data is stored in the Container as a **Layer**, which is loaded into the Container's Geometry node via the "Fetch Layer" node (the red one), and be converted into a **Component** that can be rendered.
|
||||
|
||||

|
||||
|
||||
Next, let's preview the data in Blender.
|
||||
|
||||
In the container's geometry nodes panel menu, click **Bioxel Nodes > Add a Slicer**. The addon will insert a node named "Slice" between the "Fetch Layer" and the "Output" and create a new plane object named "Slicer". Click the "Slice Viewer" button in the upper right corner of the 3D viewport to enter the preview mode, then move and rotate the "Slicer" object. You will see a slice image of the data, which should be familiar to anyone who has used any DICOM viewing software.
|
||||
|
||||

|
||||
|
||||
(If the volume disappears when you click the "Slice Viewer" button, save the file and restart Blender, it should be fixed, or you can turn on the Cycles rendering to see the slicer plane as well. The issue is caused by EEVEE's failure of reloading the shaders.)
|
||||
|
||||
The "Slicer" node is used to display the slices of the data, with an external object as the location of the slice plane. This step is not necessary for visualization, but it provides a quick way to preview the data in Blender for user perception. Next, let's turn the volumetric data into a renderable object.
|
||||
|
||||
## Cutout the Skull
|
||||
|
||||
Bone tends to have much higher CT values than soft tissue, so you can split bone and soft tissue by setting a threshold. In the Geometry Nodes panel menu of the container, click **Add > Bioxel Nodes > Component > Cutout by Threshold** to add a "Cutout" node and connect it between the "Fetch Layer" node and the "Output", and then set the "Threshold" parameter of the "Cutout by Threshold" node to 0.3 and turn on the "With Surface" option. Switch to viewport shading to "Render Preview". The node graph and the render result are shown below.
|
||||
|
||||

|
||||
|
||||
If you want the render result to be consistent with the above image, you also need to change the default light object type from "Point" to "Area" to increase the brightness, and change the Look in Color Management to "High Contrast".
|
||||
|
||||
You can understand the role of the "Threshold" parameter in shaping the output by changing it. If you feel very laggy while draging the parameter, you can temporarily turn off the "With Surface" option in the "Cutout" node. When you are satisfied, turn it on again. In addition, the volume rendering is very computationally intensive, which is also a major cause of the lag, so you can adjust the parameters in "Slice Viewer" mode first, and then do the Cycles rendering when you are satisfied.
|
||||
|
||||
You may consider using GPU for faster rendering, but please note that Bioxel Nodes only supports Optix GPUs due to its dependency on OSL (Open shader language), and the first time you turn on GPU rendering, you may need to wait for Blender to load the appropriate dependencies (the screen will get stuck), so please be patient.
|
||||
|
||||
Although the output component looks like a mesh object, it retains its internal information through its volume, so when you cut through the component, you should see an inhomogeneous cross-section made up of volume, rather than just an empty shell like any mesh object. Let's cut the skull to see its complex internal structure.
|
||||
|
||||
## Cut and Color
|
||||
|
||||
In the container's geometry nodes panel menu, click **Bioxel Nodes > Add a Cutter > Plane Cutter**, the addon will insert a "Cut" node and a "Object Cutter" node. Also, it will create a new plane object named "Plane Cutter" to the scene, at this point you should be able to see that the skull has been cut through as expected.
|
||||
|
||||
Just like the "Slicer" object, move and rotate the "Plane Cutter" and the position and direction of the cut will change accordingly. Please adjust the Cutter object to a vertical orientation so that it cuts the skull vertically, as shown below.
|
||||
|
||||

|
||||
|
||||
The CT value of the skull is inhomogeneous, which reflects the difference in substance density of the bone. We can enhance the display of this difference by coloring. In the Geometry Nodes panel menu of the container, click **Add > Bioxel Nodes > Propetry > Set Color by Ramp 5** to add the "Set Color" node and connect it after any node. Set the node's parameters "From Min" to 0.3 and "From Max" to 0.5, as shown below.
|
||||
|
||||

|
||||
|
||||
When rendering is turned on, you can clearly see that the calvaria and teeth are colored red, meaning that the bone in these areas is denser. You can try to adjust the parameters of the "Set Color" node to recognize their roles. If you feel laggy when draging the parameters, you can temporarily turn off "With Surface" and switch to "Slice Viewer" mode.
|
||||
|
||||
## Transformation
|
||||
|
||||
You may find that the position of the skull is a bit off the origin, this is due to the fact that the addon keeps the position information from the original data record during the import process. If you need to change the position, do not move the container (object) directly as you would in 3D viewport; the addon provides dedicated "Transform" node to handle transformations.
|
||||
|
||||
In the Geometry Nodes panel menu of the container, click **Bioxel Nodes > Add a Locator**, the addon will insert the "Transform Parent" node and create a new empty object named "Locator". If you move, rotate, or scale the "Locator", the skull will Transform as well. If you also want the origin of the rotational transformation to be set at the geometric center of the skull, just add a "ReCenter" node (Add > Bioxel Nodes > Transform > ReCenter) in front of the "Transform Parent" node, as shown below.
|
||||
|
||||

|
||||
|
||||
Being used to moving objects directly in the 3D viewport, you may find it strange to have an extra step to transform component like this. This is in consideration of the fact that there may be multiple components involved in one container with different transform needs, as well as future development plans for resampling mechanism, which I'll explain in more detail later.
|
||||
|
||||
## Surface Mesh
|
||||
|
||||
A mesh, made up of vertexs and faces, is the "greatest common" in the 3D world. Therefore, in order to be compatible with other 3D workflow, the addon provides the "To Surface" node (Add > Bioxel Nodes > Component > ToSurface), which converts the component into a mesh. Note that the surface mesh is not editable in the container's geometry node, and can only be connected to "Transform" and "Shader" nodes.
|
||||
|
||||
As shown below, you can connect "Slime Shader" node (Add > Bioxel Nodes > Surface > Slime Shader) after the "To Surface" node to give the surface a shader, or connect "Transform" nodes.
|
||||
|
||||

|
||||
|
||||
If you want to edit the mesh, in the Geometry Nodes panel menu of the container, click **Bioxel Nodes > Extract from Container > Extract Mesh**, the addon will create a new mesh model object prefixed with the container name, and then you can perform the usual 3D operations, such as digitally sculpting, animating, exporting to 3D print format stl, etc.
|
||||
|
||||
## Deliver Blender File
|
||||
|
||||
The layers cache is stored in a temporary folder, while the addon's custom nodes are linked to the node library file in addon directory. Both of them are exist locally by default, and if you only deliver the Blender file to other devices, the file will not work properly because the resources are missing.
|
||||
|
||||
Therefore, you need to save all temporary files before you deliver the Blender file. The procedure is simple:
|
||||
|
||||
1. Save the Blender file.
|
||||
2. in the top menu, click **Bioxel Nodes > Save Node Library**, and set the relative path.
|
||||
3. in the top menu, click **Bioxel Nodes > Save All Layers Cache** and set the relative path.
|
||||
|
||||
Zip the Blender file together with the local node library file and the layer cache files (there may be more than one).
|
||||
|
||||

|
||||
|
||||
🤗 If you can follow the documentation up to this point, you're already started!
|
||||
@@ -1,28 +1,20 @@
|
||||
@import url("https://fontsapi.zeoseven.com/292/main/result.css");
|
||||
@import url("https://fontsapi.zeoseven.com/293/main/result.css");
|
||||
|
||||
/* [data-md-color-scheme="slate"] {
|
||||
[data-md-color-scheme="slate"] {
|
||||
--md-code-hl-string-color: #8b8b8b;
|
||||
--md-code-hl-keyword-color: #ffe8a3;
|
||||
--md-code-hl-number-color: #ffe8a3;
|
||||
--md-typeset-a-color: #ffe8a3;
|
||||
--md-code-hl-keyword-color: white;
|
||||
--md-code-hl-number-color: white;
|
||||
--md-typeset-a-color: white;
|
||||
}
|
||||
|
||||
[data-md-color-scheme="default"] {
|
||||
--md-code-hl-string-color: #444444;
|
||||
--md-code-hl-keyword-color: #bd9100;
|
||||
--md-code-hl-number-color: #bd9100;
|
||||
--md-code-hl-keyword-color: black;
|
||||
--md-code-hl-number-color: black;
|
||||
}
|
||||
|
||||
[data-md-color-scheme=slate][data-md-color-primary=black] {
|
||||
--md-typeset-a-color: #ffe8a3;
|
||||
--md-typeset-a-color: white;
|
||||
}
|
||||
|
||||
[data-md-color-scheme=default][data-md-color-primary=black] {
|
||||
--md-typeset-a-color: #bd9100;
|
||||
} */
|
||||
|
||||
:root {
|
||||
--md-text-font: "LXGW WenKai";
|
||||
--md-code-font: "LXGW WenKai Mono";
|
||||
--md-typeset-a-color: black;
|
||||
}
|
||||
38
mkdocs.yml
@@ -1,5 +1,5 @@
|
||||
site_name: Bioxel Nodes Docs
|
||||
site_url: https://docs.omoolab.xyz/bioxelnodes/
|
||||
site_name: Bioxel Nodes Handbook
|
||||
site_url: https://omoolab.github.io/BioxelNodes/
|
||||
site_author: OmooLab
|
||||
site_description: Bioxel Nodes is a Blender add-on for scientific volumetric data visualization.
|
||||
|
||||
@@ -7,21 +7,22 @@ repo_name: OmooLab/BioxelNodes
|
||||
repo_url: https://github.com/OmooLab/BioxelNodes
|
||||
|
||||
nav:
|
||||
- 胞素节点:
|
||||
- index.md
|
||||
- gallery.md
|
||||
- 快速开始:
|
||||
- installation.md
|
||||
- basics.md
|
||||
- advanced.md
|
||||
- dataset.md
|
||||
- performance.md
|
||||
- index.md
|
||||
- Getting Started:
|
||||
- Installation: installation.md
|
||||
- Step by Step: step_by_step.md
|
||||
- Advanced Usage: advanced_usage.md
|
||||
- Support Format: support_format.md
|
||||
- Improve Performance: improve_performance.md
|
||||
- FAQ: faq.md
|
||||
- Tutorials:
|
||||
- SARS-Cov-2: SARS-Cov-2.md
|
||||
|
||||
theme:
|
||||
name: material
|
||||
favicon: assets/logo.png
|
||||
logo: assets/logo.png
|
||||
language: zh
|
||||
language: en
|
||||
font:
|
||||
text: Open Sans
|
||||
code: Cascadia Code
|
||||
@@ -61,6 +62,7 @@ theme:
|
||||
extra:
|
||||
version:
|
||||
provider: mike
|
||||
default: latest
|
||||
|
||||
extra_css:
|
||||
- stylesheets/extra.css
|
||||
@@ -70,18 +72,6 @@ copyright: Copyright © 2020 - 2024 Omoolab
|
||||
plugins:
|
||||
- search
|
||||
- mkdocstrings
|
||||
- i18n:
|
||||
docs_structure: suffix
|
||||
languages:
|
||||
- locale: zh
|
||||
name: 中文
|
||||
default: true
|
||||
- locale: en
|
||||
name: English
|
||||
nav_translations:
|
||||
胞素节点: Bioxel Nodes
|
||||
快速开始: Getting Started
|
||||
案例教程: Tutorials
|
||||
|
||||
markdown_extensions:
|
||||
- attr_list
|
||||
|
||||
@@ -1,8 +1,8 @@
|
||||
[project]
|
||||
name = "bioxelnodes"
|
||||
version = "2.0.4"
|
||||
version = "1.0.9"
|
||||
description = ""
|
||||
authors = [{ name = "MaNan", email = "icrdr2010@outlook.com" }]
|
||||
authors = [{ name = "Ma Nan", email = "icrdr2010@outlook.com" }]
|
||||
requires-python = ">=3.11.0,<3.12.dev0"
|
||||
readme = "README.md"
|
||||
license = "MIT"
|
||||
@@ -13,12 +13,11 @@ dependencies = [
|
||||
"h5py==3.11.0",
|
||||
"transforms3d==0.4.2",
|
||||
"matplotlib==3.10.7",
|
||||
"scipy==1.16.3",
|
||||
]
|
||||
|
||||
[dependency-groups]
|
||||
dev = [
|
||||
"bpy==5.0.0",
|
||||
"bpy>=4.2.0,<5",
|
||||
"pytest>=8.3.2,<9",
|
||||
"pytest-dependency>=0.6.0,<0.7",
|
||||
"pytest-cov>=5.0.0,<6",
|
||||
@@ -28,9 +27,6 @@ dev = [
|
||||
"mike>=2.1.2,<3",
|
||||
"tomlkit>=0.13.0,<0.14",
|
||||
"pip>=25.3",
|
||||
"mkdocstrings[python]>=1.0.4",
|
||||
"mkdocs-static-i18n[material]>=1.3.1",
|
||||
"mkdocs-click>=0.9.0",
|
||||
]
|
||||
|
||||
[build-system]
|
||||
|
||||
BIN
scipy_ndimage/linux-x64/_nd_image.cpython-313-x86_64-linux-gnu.so
LFS
Normal file
BIN
scipy_ndimage/macos-arm64/_nd_image.cpython-311-darwin.so
Normal file
BIN
scipy_ndimage/macos-arm64/_nd_image.cpython-313-darwin.so
LFS
Normal file
BIN
scipy_ndimage/macos-x64/_nd_image.cpython-311-darwin.so
Normal file
BIN
scipy_ndimage/macos-x64/_nd_image.cpython-313-darwin.so
LFS
Normal file
BIN
scipy_ndimage/windows-x64/_nd_image.cp311-win_amd64.pyd
Normal file
BIN
scipy_ndimage/windows-x64/_nd_image.cp313-win_amd64.pyd
Normal file
@@ -1,7 +1,7 @@
|
||||
import bpy
|
||||
import bpy.utils.previews as previews
|
||||
|
||||
from .constants import PREVIEW_COLLECTIONS
|
||||
from .constants import NODE_LIB_DIRPATH, PREVIEW_COLLECTIONS
|
||||
from .props import _bioxel_layer_items, _update_layer_gallery, _update_snapshot_z
|
||||
|
||||
from . import auto_load
|
||||
@@ -9,7 +9,36 @@ from . import menus
|
||||
|
||||
auto_load.init()
|
||||
|
||||
CLI_COMMAND_NAME = "bioxelnodes_import_worker"
|
||||
|
||||
def add_asset_library():
|
||||
"""Add Bioxel asset library, ensuring only one exists by removing duplicates first."""
|
||||
if not NODE_LIB_DIRPATH.exists():
|
||||
print(f"Node library path does not exist - {NODE_LIB_DIRPATH}")
|
||||
return
|
||||
|
||||
lib_path_str = str(NODE_LIB_DIRPATH)
|
||||
prefs = bpy.context.preferences.filepaths.asset_libraries
|
||||
|
||||
# Add new library
|
||||
new_lib = prefs.new()
|
||||
new_lib.name = "O Bioxel"
|
||||
new_lib.path = lib_path_str
|
||||
new_lib.import_method = "PACK"
|
||||
|
||||
print(f"Add Bioxel Nodes library: {lib_path_str}")
|
||||
|
||||
|
||||
def remove_asset_library_if_exists():
|
||||
"""Remove the Bioxel asset library entry if it was added (by path or name)."""
|
||||
lib_path_str = str(NODE_LIB_DIRPATH)
|
||||
prefs = bpy.context.preferences.filepaths.asset_libraries
|
||||
|
||||
for lib in list(prefs):
|
||||
try:
|
||||
if "Bioxel" in lib.name or lib.path == lib_path_str:
|
||||
prefs.remove(lib)
|
||||
except Exception:
|
||||
continue
|
||||
|
||||
|
||||
def register():
|
||||
@@ -43,11 +72,12 @@ def register():
|
||||
|
||||
auto_load.register()
|
||||
menus.add()
|
||||
register_cli_commands()
|
||||
remove_asset_library_if_exists()
|
||||
add_asset_library()
|
||||
|
||||
|
||||
def unregister():
|
||||
unregister_cli_commands()
|
||||
remove_asset_library_if_exists()
|
||||
menus.remove()
|
||||
auto_load.unregister()
|
||||
|
||||
@@ -60,21 +90,3 @@ def unregister():
|
||||
for pcoll in PREVIEW_COLLECTIONS.values():
|
||||
previews.remove(pcoll)
|
||||
PREVIEW_COLLECTIONS.clear()
|
||||
|
||||
|
||||
def import_worker_cli(args):
|
||||
from .operators import io_worker
|
||||
|
||||
return io_worker.main(args)
|
||||
|
||||
|
||||
def register_cli_commands():
|
||||
unregister_cli_commands()
|
||||
bpy.utils.register_cli_command(CLI_COMMAND_NAME, import_worker_cli)
|
||||
|
||||
|
||||
def unregister_cli_commands():
|
||||
try:
|
||||
bpy.utils.unregister_cli_command(CLI_COMMAND_NAME)
|
||||
except Exception:
|
||||
pass
|
||||
|
||||
@@ -1,134 +0,0 @@
|
||||
import bpy
|
||||
from pathlib import Path
|
||||
|
||||
from .constants import LATEST_NODE_LIB_PATH, NODE_LIB_DIRPATH, NODE_LIB_FILENAME
|
||||
|
||||
|
||||
ASSET_LIBRARY_NAME = "O Bioxel"
|
||||
ASSET_LIBRARY_READY = "READY"
|
||||
ASSET_LIBRARY_OUTDATED = "OUTDATED"
|
||||
ASSET_LIBRARY_MISSING = "MISSING"
|
||||
|
||||
STATUS_MESSAGES = {
|
||||
"missing": "O Bioxel asset library is not installed.",
|
||||
"missing_blend": "O Bioxel node library file is missing.",
|
||||
"outdated": "O Bioxel node library needs update.",
|
||||
"ready": "O Bioxel asset library is ready.",
|
||||
}
|
||||
|
||||
|
||||
def _asset_library_path():
|
||||
return str(NODE_LIB_DIRPATH)
|
||||
|
||||
|
||||
def _normalized_path(path):
|
||||
return Path(bpy.path.abspath(path)).resolve()
|
||||
|
||||
|
||||
def _asset_libraries():
|
||||
return bpy.context.preferences.filepaths.asset_libraries
|
||||
|
||||
|
||||
def _find_bioxel_asset_library():
|
||||
lib_path = _normalized_path(_asset_library_path())
|
||||
named_lib = None
|
||||
|
||||
for lib in _asset_libraries():
|
||||
try:
|
||||
if _normalized_path(lib.path) == lib_path:
|
||||
return lib
|
||||
if lib.name == ASSET_LIBRARY_NAME:
|
||||
named_lib = lib
|
||||
except Exception:
|
||||
continue
|
||||
|
||||
return named_lib
|
||||
|
||||
|
||||
def _node_lib_path_for_library(lib):
|
||||
return _normalized_path(lib.path) / NODE_LIB_FILENAME
|
||||
|
||||
|
||||
def get_bioxel_asset_library():
|
||||
lib_path = _normalized_path(_asset_library_path())
|
||||
|
||||
for lib in _asset_libraries():
|
||||
try:
|
||||
if _normalized_path(lib.path) == lib_path:
|
||||
return lib
|
||||
except Exception:
|
||||
continue
|
||||
|
||||
return None
|
||||
|
||||
|
||||
def get_bioxel_asset_library_status():
|
||||
lib = _find_bioxel_asset_library()
|
||||
lib_path = _normalized_path(_asset_library_path())
|
||||
|
||||
if lib is None:
|
||||
return {"code": ASSET_LIBRARY_MISSING, "reason": "missing",
|
||||
"message": STATUS_MESSAGES["missing"]}
|
||||
|
||||
try:
|
||||
installed_lib_path = _normalized_path(lib.path)
|
||||
except Exception:
|
||||
return {"code": ASSET_LIBRARY_MISSING, "reason": "missing",
|
||||
"message": STATUS_MESSAGES["missing"]}
|
||||
|
||||
if not _node_lib_path_for_library(lib).is_file():
|
||||
return {"code": ASSET_LIBRARY_MISSING, "reason": "missing_blend",
|
||||
"message": STATUS_MESSAGES["missing_blend"]}
|
||||
|
||||
if installed_lib_path != lib_path:
|
||||
return {"code": ASSET_LIBRARY_OUTDATED, "reason": "outdated",
|
||||
"message": STATUS_MESSAGES["outdated"]}
|
||||
|
||||
return {"code": ASSET_LIBRARY_READY, "reason": "ready",
|
||||
"message": STATUS_MESSAGES["ready"]}
|
||||
|
||||
|
||||
def has_bioxel_asset_library():
|
||||
return get_bioxel_asset_library_status()["code"] in {
|
||||
ASSET_LIBRARY_READY,
|
||||
ASSET_LIBRARY_OUTDATED,
|
||||
}
|
||||
|
||||
|
||||
def add_bioxel_asset_library():
|
||||
if not NODE_LIB_DIRPATH.exists():
|
||||
raise FileNotFoundError(f"Node library path does not exist: {NODE_LIB_DIRPATH}")
|
||||
if not LATEST_NODE_LIB_PATH.is_file():
|
||||
raise FileNotFoundError(f"Node library file does not exist: {LATEST_NODE_LIB_PATH}")
|
||||
|
||||
prefs = _asset_libraries()
|
||||
lib = _find_bioxel_asset_library()
|
||||
|
||||
if lib is None:
|
||||
for item in prefs:
|
||||
try:
|
||||
if item.name == ASSET_LIBRARY_NAME:
|
||||
lib = item
|
||||
break
|
||||
except Exception:
|
||||
continue
|
||||
|
||||
if lib is None:
|
||||
lib = prefs.new()
|
||||
|
||||
lib.name = ASSET_LIBRARY_NAME
|
||||
lib.path = _asset_library_path()
|
||||
lib.import_method = "PACK"
|
||||
return lib
|
||||
|
||||
|
||||
def remove_bioxel_asset_library_if_exists():
|
||||
lib_path = _normalized_path(_asset_library_path())
|
||||
prefs = _asset_libraries()
|
||||
|
||||
for lib in list(prefs):
|
||||
try:
|
||||
if "Bioxel" in lib.name or _normalized_path(lib.path) == lib_path:
|
||||
prefs.remove(lib)
|
||||
except Exception:
|
||||
continue
|
||||
@@ -15,9 +15,6 @@ blender_version = bpy.app.version
|
||||
|
||||
modules = None
|
||||
ordered_classes = None
|
||||
SKIP_MODULE_NAMES = {
|
||||
"operators.io_worker",
|
||||
}
|
||||
|
||||
|
||||
def init():
|
||||
@@ -60,8 +57,6 @@ def get_all_submodules(directory):
|
||||
|
||||
def iter_submodules(path, package_name):
|
||||
for name in sorted(iter_submodule_names(path)):
|
||||
if name in SKIP_MODULE_NAMES:
|
||||
continue
|
||||
yield importlib.import_module("." + name, package_name)
|
||||
|
||||
|
||||
|
||||
@@ -7,7 +7,8 @@ try:
|
||||
except ImportError:
|
||||
vdb = None
|
||||
|
||||
from scipy import ndimage as ndi
|
||||
from . import scipy
|
||||
from . import scipy as ndi
|
||||
|
||||
# 3rd-party
|
||||
import transforms3d
|
||||
@@ -82,17 +83,21 @@ class Layer():
|
||||
for f in range(self.frame_count):
|
||||
mask_frame = mask[f, :, :, :]
|
||||
if smooth > 0:
|
||||
mask_frame = ndi.median_filter(mask_frame.astype(np.float32),
|
||||
mode="nearest",
|
||||
size=smooth)
|
||||
mask_frame = scipy.median_filter(mask_frame.astype(np.float32),
|
||||
mode="nearest",
|
||||
size=smooth)
|
||||
# mask_frame = scipy.median_filter(
|
||||
# mask_frame.astype(np.float32), size=2)
|
||||
mask_frames += (mask_frame,)
|
||||
elif mask.ndim == 3:
|
||||
for f in range(self.frame_count):
|
||||
mask_frame = mask[:, :, :]
|
||||
if smooth > 0:
|
||||
mask_frame = ndi.median_filter(mask_frame.astype(np.float32),
|
||||
mode="nearest",
|
||||
size=smooth)
|
||||
mask_frame = scipy.median_filter(mask_frame.astype(np.float32),
|
||||
mode="nearest",
|
||||
size=smooth)
|
||||
# mask_frame = scipy.median_filter(
|
||||
# mask_frame.astype(np.float32), size=2)
|
||||
mask_frames += (mask_frame,)
|
||||
else:
|
||||
raise Exception("Mask shape order should be TXYZ or XYZ")
|
||||
@@ -122,9 +127,9 @@ class Layer():
|
||||
|
||||
frame = data[f, :, :, :, :]
|
||||
if smooth > 0:
|
||||
frame = ndi.median_filter(frame.astype(np.float32),
|
||||
mode="nearest",
|
||||
size=smooth)
|
||||
frame = scipy.median_filter(frame.astype(np.float32),
|
||||
mode="nearest",
|
||||
size=smooth)
|
||||
|
||||
factors = np.divide(self.shape, shape)
|
||||
zoom_factors = [1 / f for f in factors]
|
||||
|
||||
5
src/bioxelnodes/bioxel/scipy/__init__.py
Normal file
@@ -0,0 +1,5 @@
|
||||
from ._interpolation import zoom
|
||||
from ._filters import (gaussian_filter,
|
||||
median_filter,
|
||||
maximum_filter,
|
||||
minimum_filter)
|
||||
1823
src/bioxelnodes/bioxel/scipy/_filters.py
Normal file
314
src/bioxelnodes/bioxel/scipy/_interpolation.py
Normal file
@@ -0,0 +1,314 @@
|
||||
import numpy as np
|
||||
import warnings
|
||||
|
||||
from . import _ni_support
|
||||
from . import _nd_image
|
||||
from ._utils import normalize_axis_index
|
||||
|
||||
|
||||
def _prepad_for_spline_filter(input, mode, cval):
|
||||
if mode in ['nearest', 'grid-constant']:
|
||||
npad = 12
|
||||
if mode == 'grid-constant':
|
||||
padded = np.pad(input, npad, mode='constant',
|
||||
constant_values=cval)
|
||||
elif mode == 'nearest':
|
||||
padded = np.pad(input, npad, mode='edge')
|
||||
else:
|
||||
# other modes have exact boundary conditions implemented so
|
||||
# no prepadding is needed
|
||||
npad = 0
|
||||
padded = input
|
||||
return padded, npad
|
||||
|
||||
|
||||
def spline_filter1d(input, order=3, axis=-1, output=np.float64,
|
||||
mode='mirror'):
|
||||
"""
|
||||
Calculate a 1-D spline filter along the given axis.
|
||||
|
||||
The lines of the array along the given axis are filtered by a
|
||||
spline filter. The order of the spline must be >= 2 and <= 5.
|
||||
|
||||
Parameters
|
||||
----------
|
||||
%(input)s
|
||||
order : int, optional
|
||||
The order of the spline, default is 3.
|
||||
axis : int, optional
|
||||
The axis along which the spline filter is applied. Default is the last
|
||||
axis.
|
||||
output : ndarray or dtype, optional
|
||||
The array in which to place the output, or the dtype of the returned
|
||||
array. Default is ``numpy.float64``.
|
||||
%(mode_interp_mirror)s
|
||||
|
||||
Returns
|
||||
-------
|
||||
spline_filter1d : ndarray
|
||||
The filtered input.
|
||||
|
||||
See Also
|
||||
--------
|
||||
spline_filter : Multidimensional spline filter.
|
||||
|
||||
Notes
|
||||
-----
|
||||
All of the interpolation functions in `ndimage` do spline interpolation of
|
||||
the input image. If using B-splines of `order > 1`, the input image
|
||||
values have to be converted to B-spline coefficients first, which is
|
||||
done by applying this 1-D filter sequentially along all
|
||||
axes of the input. All functions that require B-spline coefficients
|
||||
will automatically filter their inputs, a behavior controllable with
|
||||
the `prefilter` keyword argument. For functions that accept a `mode`
|
||||
parameter, the result will only be correct if it matches the `mode`
|
||||
used when filtering.
|
||||
|
||||
For complex-valued `input`, this function processes the real and imaginary
|
||||
components independently.
|
||||
|
||||
.. versionadded:: 1.6.0
|
||||
Complex-valued support added.
|
||||
|
||||
Examples
|
||||
--------
|
||||
We can filter an image using 1-D spline along the given axis:
|
||||
|
||||
>>> from scipy.ndimage import spline_filter1d
|
||||
>>> import numpy as np
|
||||
>>> import matplotlib.pyplot as plt
|
||||
>>> orig_img = np.eye(20) # create an image
|
||||
>>> orig_img[10, :] = 1.0
|
||||
>>> sp_filter_axis_0 = spline_filter1d(orig_img, axis=0)
|
||||
>>> sp_filter_axis_1 = spline_filter1d(orig_img, axis=1)
|
||||
>>> f, ax = plt.subplots(1, 3, sharex=True)
|
||||
>>> for ind, data in enumerate([[orig_img, "original image"],
|
||||
... [sp_filter_axis_0, "spline filter (axis=0)"],
|
||||
... [sp_filter_axis_1, "spline filter (axis=1)"]]):
|
||||
... ax[ind].imshow(data[0], cmap='gray_r')
|
||||
... ax[ind].set_title(data[1])
|
||||
>>> plt.tight_layout()
|
||||
>>> plt.show()
|
||||
|
||||
"""
|
||||
if order < 0 or order > 5:
|
||||
raise RuntimeError('spline order not supported')
|
||||
input = np.asarray(input)
|
||||
complex_output = np.iscomplexobj(input)
|
||||
output = _ni_support._get_output(output, input,
|
||||
complex_output=complex_output)
|
||||
if complex_output:
|
||||
spline_filter1d(input.real, order, axis, output.real, mode)
|
||||
spline_filter1d(input.imag, order, axis, output.imag, mode)
|
||||
return output
|
||||
if order in [0, 1]:
|
||||
output[...] = np.array(input)
|
||||
else:
|
||||
mode = _ni_support._extend_mode_to_code(mode)
|
||||
axis = normalize_axis_index(axis, input.ndim)
|
||||
_nd_image.spline_filter1d(input, order, axis, output, mode)
|
||||
return output
|
||||
|
||||
|
||||
def spline_filter(input, order=3, output=np.float64, mode='mirror'):
|
||||
"""
|
||||
Multidimensional spline filter.
|
||||
|
||||
Parameters
|
||||
----------
|
||||
%(input)s
|
||||
order : int, optional
|
||||
The order of the spline, default is 3.
|
||||
output : ndarray or dtype, optional
|
||||
The array in which to place the output, or the dtype of the returned
|
||||
array. Default is ``numpy.float64``.
|
||||
%(mode_interp_mirror)s
|
||||
|
||||
Returns
|
||||
-------
|
||||
spline_filter : ndarray
|
||||
Filtered array. Has the same shape as `input`.
|
||||
|
||||
See Also
|
||||
--------
|
||||
spline_filter1d : Calculate a 1-D spline filter along the given axis.
|
||||
|
||||
Notes
|
||||
-----
|
||||
The multidimensional filter is implemented as a sequence of
|
||||
1-D spline filters. The intermediate arrays are stored
|
||||
in the same data type as the output. Therefore, for output types
|
||||
with a limited precision, the results may be imprecise because
|
||||
intermediate results may be stored with insufficient precision.
|
||||
|
||||
For complex-valued `input`, this function processes the real and imaginary
|
||||
components independently.
|
||||
|
||||
.. versionadded:: 1.6.0
|
||||
Complex-valued support added.
|
||||
|
||||
Examples
|
||||
--------
|
||||
We can filter an image using multidimentional splines:
|
||||
|
||||
>>> from scipy.ndimage import spline_filter
|
||||
>>> import numpy as np
|
||||
>>> import matplotlib.pyplot as plt
|
||||
>>> orig_img = np.eye(20) # create an image
|
||||
>>> orig_img[10, :] = 1.0
|
||||
>>> sp_filter = spline_filter(orig_img, order=3)
|
||||
>>> f, ax = plt.subplots(1, 2, sharex=True)
|
||||
>>> for ind, data in enumerate([[orig_img, "original image"],
|
||||
... [sp_filter, "spline filter"]]):
|
||||
... ax[ind].imshow(data[0], cmap='gray_r')
|
||||
... ax[ind].set_title(data[1])
|
||||
>>> plt.tight_layout()
|
||||
>>> plt.show()
|
||||
|
||||
"""
|
||||
if order < 2 or order > 5:
|
||||
raise RuntimeError('spline order not supported')
|
||||
input = np.asarray(input)
|
||||
complex_output = np.iscomplexobj(input)
|
||||
output = _ni_support._get_output(output, input,
|
||||
complex_output=complex_output)
|
||||
if complex_output:
|
||||
spline_filter(input.real, order, output.real, mode)
|
||||
spline_filter(input.imag, order, output.imag, mode)
|
||||
return output
|
||||
if order not in [0, 1] and input.ndim > 0:
|
||||
for axis in range(input.ndim):
|
||||
spline_filter1d(input, order, axis, output=output, mode=mode)
|
||||
input = output
|
||||
else:
|
||||
output[...] = input[...]
|
||||
return output
|
||||
|
||||
|
||||
def zoom(input, zoom, output=None, order=3, mode='constant', cval=0.0,
|
||||
prefilter=True, *, grid_mode=False):
|
||||
"""
|
||||
Zoom an array.
|
||||
|
||||
The array is zoomed using spline interpolation of the requested order.
|
||||
|
||||
Parameters
|
||||
----------
|
||||
%(input)s
|
||||
zoom : float or sequence
|
||||
The zoom factor along the axes. If a float, `zoom` is the same for each
|
||||
axis. If a sequence, `zoom` should contain one value for each axis.
|
||||
%(output)s
|
||||
order : int, optional
|
||||
The order of the spline interpolation, default is 3.
|
||||
The order has to be in the range 0-5.
|
||||
%(mode_interp_constant)s
|
||||
%(cval)s
|
||||
%(prefilter)s
|
||||
grid_mode : bool, optional
|
||||
If False, the distance from the pixel centers is zoomed. Otherwise, the
|
||||
distance including the full pixel extent is used. For example, a 1d
|
||||
signal of length 5 is considered to have length 4 when `grid_mode` is
|
||||
False, but length 5 when `grid_mode` is True. See the following
|
||||
visual illustration:
|
||||
|
||||
.. code-block:: text
|
||||
|
||||
| pixel 1 | pixel 2 | pixel 3 | pixel 4 | pixel 5 |
|
||||
|<-------------------------------------->|
|
||||
vs.
|
||||
|<----------------------------------------------->|
|
||||
|
||||
The starting point of the arrow in the diagram above corresponds to
|
||||
coordinate location 0 in each mode.
|
||||
|
||||
Returns
|
||||
-------
|
||||
zoom : ndarray
|
||||
The zoomed input.
|
||||
|
||||
Notes
|
||||
-----
|
||||
For complex-valued `input`, this function zooms the real and imaginary
|
||||
components independently.
|
||||
|
||||
.. versionadded:: 1.6.0
|
||||
Complex-valued support added.
|
||||
|
||||
Examples
|
||||
--------
|
||||
>>> from scipy import ndimage, datasets
|
||||
>>> import matplotlib.pyplot as plt
|
||||
|
||||
>>> fig = plt.figure()
|
||||
>>> ax1 = fig.add_subplot(121) # left side
|
||||
>>> ax2 = fig.add_subplot(122) # right side
|
||||
>>> ascent = datasets.ascent()
|
||||
>>> result = ndimage.zoom(ascent, 3.0)
|
||||
>>> ax1.imshow(ascent, vmin=0, vmax=255)
|
||||
>>> ax2.imshow(result, vmin=0, vmax=255)
|
||||
>>> plt.show()
|
||||
|
||||
>>> print(ascent.shape)
|
||||
(512, 512)
|
||||
|
||||
>>> print(result.shape)
|
||||
(1536, 1536)
|
||||
"""
|
||||
if order < 0 or order > 5:
|
||||
raise RuntimeError('spline order not supported')
|
||||
input = np.asarray(input)
|
||||
if input.ndim < 1:
|
||||
raise RuntimeError('input and output rank must be > 0')
|
||||
zoom = _ni_support._normalize_sequence(zoom, input.ndim)
|
||||
output_shape = tuple(
|
||||
[int(round(ii * jj)) for ii, jj in zip(input.shape, zoom)])
|
||||
complex_output = np.iscomplexobj(input)
|
||||
output = _ni_support._get_output(output, input, shape=output_shape,
|
||||
complex_output=complex_output)
|
||||
if complex_output:
|
||||
# import under different name to avoid confusion with zoom parameter
|
||||
from scipy.ndimage._interpolation import zoom as _zoom
|
||||
|
||||
kwargs = dict(order=order, mode=mode, prefilter=prefilter)
|
||||
_zoom(input.real, zoom, output=output.real,
|
||||
cval=np.real(cval), **kwargs)
|
||||
_zoom(input.imag, zoom, output=output.imag,
|
||||
cval=np.imag(cval), **kwargs)
|
||||
return output
|
||||
if prefilter and order > 1:
|
||||
padded, npad = _prepad_for_spline_filter(input, mode, cval)
|
||||
filtered = spline_filter(padded, order, output=np.float64, mode=mode)
|
||||
else:
|
||||
npad = 0
|
||||
filtered = input
|
||||
if grid_mode:
|
||||
# warn about modes that may have surprising behavior
|
||||
suggest_mode = None
|
||||
if mode == 'constant':
|
||||
suggest_mode = 'grid-constant'
|
||||
elif mode == 'wrap':
|
||||
suggest_mode = 'grid-wrap'
|
||||
if suggest_mode is not None:
|
||||
warnings.warn(
|
||||
(f"It is recommended to use mode = {suggest_mode} instead of {mode} "
|
||||
f"when grid_mode is True."),
|
||||
stacklevel=2
|
||||
)
|
||||
mode = _ni_support._extend_mode_to_code(mode)
|
||||
|
||||
zoom_div = np.array(output_shape)
|
||||
zoom_nominator = np.array(input.shape)
|
||||
if not grid_mode:
|
||||
zoom_div -= 1
|
||||
zoom_nominator -= 1
|
||||
|
||||
# Zooming to infinite values is unpredictable, so just choose
|
||||
# zoom factor 1 instead
|
||||
zoom = np.divide(zoom_nominator, zoom_div,
|
||||
out=np.ones_like(input.shape, dtype=np.float64),
|
||||
where=zoom_div != 0)
|
||||
zoom = np.ascontiguousarray(zoom)
|
||||
_nd_image.zoom_shift(filtered, zoom, None, output, order, mode, cval, npad,
|
||||
grid_mode)
|
||||
return output
|
||||
120
src/bioxelnodes/bioxel/scipy/_ni_support.py
Normal file
@@ -0,0 +1,120 @@
|
||||
# Copyright (C) 2003-2005 Peter J. Verveer
|
||||
#
|
||||
# Redistribution and use in source and binary forms, with or without
|
||||
# modification, are permitted provided that the following conditions
|
||||
# are met:
|
||||
#
|
||||
# 1. Redistributions of source code must retain the above copyright
|
||||
# notice, this list of conditions and the following disclaimer.
|
||||
#
|
||||
# 2. Redistributions in binary form must reproduce the above
|
||||
# copyright notice, this list of conditions and the following
|
||||
# disclaimer in the documentation and/or other materials provided
|
||||
# with the distribution.
|
||||
#
|
||||
# 3. The name of the author may not be used to endorse or promote
|
||||
# products derived from this software without specific prior
|
||||
# written permission.
|
||||
#
|
||||
# THIS SOFTWARE IS PROVIDED BY THE AUTHOR ``AS IS'' AND ANY EXPRESS
|
||||
# OR IMPLIED WARRANTIES, INCLUDING, BUT NOT LIMITED TO, THE IMPLIED
|
||||
# WARRANTIES OF MERCHANTABILITY AND FITNESS FOR A PARTICULAR PURPOSE
|
||||
# ARE DISCLAIMED. IN NO EVENT SHALL THE AUTHOR BE LIABLE FOR ANY
|
||||
# DIRECT, INDIRECT, INCIDENTAL, SPECIAL, EXEMPLARY, OR CONSEQUENTIAL
|
||||
# DAMAGES (INCLUDING, BUT NOT LIMITED TO, PROCUREMENT OF SUBSTITUTE
|
||||
# GOODS OR SERVICES; LOSS OF USE, DATA, OR PROFITS; OR BUSINESS
|
||||
# INTERRUPTION) HOWEVER CAUSED AND ON ANY THEORY OF LIABILITY,
|
||||
# WHETHER IN CONTRACT, STRICT LIABILITY, OR TORT (INCLUDING
|
||||
# NEGLIGENCE OR OTHERWISE) ARISING IN ANY WAY OUT OF THE USE OF THIS
|
||||
# SOFTWARE, EVEN IF ADVISED OF THE POSSIBILITY OF SUCH DAMAGE.
|
||||
|
||||
from collections.abc import Iterable
|
||||
import operator
|
||||
import warnings
|
||||
import numpy as np
|
||||
|
||||
|
||||
def _extend_mode_to_code(mode):
|
||||
"""Convert an extension mode to the corresponding integer code.
|
||||
"""
|
||||
if mode == 'nearest':
|
||||
return 0
|
||||
elif mode == 'wrap':
|
||||
return 1
|
||||
elif mode in ['reflect', 'grid-mirror']:
|
||||
return 2
|
||||
elif mode == 'mirror':
|
||||
return 3
|
||||
elif mode == 'constant':
|
||||
return 4
|
||||
elif mode == 'grid-wrap':
|
||||
return 5
|
||||
elif mode == 'grid-constant':
|
||||
return 6
|
||||
else:
|
||||
raise RuntimeError('boundary mode not supported')
|
||||
|
||||
|
||||
def _normalize_sequence(input, rank):
|
||||
"""If input is a scalar, create a sequence of length equal to the
|
||||
rank by duplicating the input. If input is a sequence,
|
||||
check if its length is equal to the length of array.
|
||||
"""
|
||||
is_str = isinstance(input, str)
|
||||
if not is_str and isinstance(input, Iterable):
|
||||
normalized = list(input)
|
||||
if len(normalized) != rank:
|
||||
err = "sequence argument must have length equal to input rank"
|
||||
raise RuntimeError(err)
|
||||
else:
|
||||
normalized = [input] * rank
|
||||
return normalized
|
||||
|
||||
|
||||
def _get_output(output, input, shape=None, complex_output=False):
|
||||
if shape is None:
|
||||
shape = input.shape
|
||||
if output is None:
|
||||
if not complex_output:
|
||||
output = np.zeros(shape, dtype=input.dtype.name)
|
||||
else:
|
||||
complex_type = np.promote_types(input.dtype, np.complex64)
|
||||
output = np.zeros(shape, dtype=complex_type)
|
||||
elif isinstance(output, (type, np.dtype)):
|
||||
# Classes (like `np.float32`) and dtypes are interpreted as dtype
|
||||
if complex_output and np.dtype(output).kind != 'c':
|
||||
warnings.warn(
|
||||
"promoting specified output dtype to complex", stacklevel=3)
|
||||
output = np.promote_types(output, np.complex64)
|
||||
output = np.zeros(shape, dtype=output)
|
||||
elif isinstance(output, str):
|
||||
output = np.dtype(output)
|
||||
if complex_output and output.kind != 'c':
|
||||
raise RuntimeError("output must have complex dtype")
|
||||
elif not issubclass(output.type, np.number):
|
||||
raise RuntimeError("output must have numeric dtype")
|
||||
output = np.zeros(shape, dtype=output)
|
||||
elif output.shape != shape:
|
||||
raise RuntimeError("output shape not correct")
|
||||
elif complex_output and output.dtype.kind != 'c':
|
||||
raise RuntimeError("output must have complex dtype")
|
||||
return output
|
||||
|
||||
|
||||
def _check_axes(axes, ndim):
|
||||
if axes is None:
|
||||
return tuple(range(ndim))
|
||||
elif np.isscalar(axes):
|
||||
axes = (operator.index(axes),)
|
||||
elif isinstance(axes, Iterable):
|
||||
for ax in axes:
|
||||
axes = tuple(operator.index(ax) for ax in axes)
|
||||
if ax < -ndim or ax > ndim - 1:
|
||||
raise ValueError(f"specified axis: {ax} is out of range")
|
||||
axes = tuple(ax % ndim if ax < 0 else ax for ax in axes)
|
||||
else:
|
||||
message = "axes must be an integer, iterable of integers, or None"
|
||||
raise ValueError(message)
|
||||
if len(tuple(set(axes))) != len(axes):
|
||||
raise ValueError("axes must be unique")
|
||||
return axes
|
||||
10
src/bioxelnodes/bioxel/scipy/_utils.py
Normal file
@@ -0,0 +1,10 @@
|
||||
|
||||
def normalize_axis_index(axis, ndim):
|
||||
# Check if `axis` is in the correct range and normalize it
|
||||
if axis < -ndim or axis >= ndim:
|
||||
msg = f"axis {axis} is out of bounds for array of dimension {ndim}"
|
||||
raise Exception(msg)
|
||||
|
||||
if axis < 0:
|
||||
axis = axis + ndim
|
||||
return axis
|
||||
1
src/bioxelnodes/bioxel/skimage/__init__.py
Normal file
@@ -0,0 +1 @@
|
||||
from ._warps import resize
|
||||
37
src/bioxelnodes/bioxel/skimage/_utils.py
Normal file
@@ -0,0 +1,37 @@
|
||||
import numpy as np
|
||||
|
||||
|
||||
def convert_to_float(image, preserve_range):
|
||||
"""Convert input image to float image with the appropriate range.
|
||||
|
||||
Parameters
|
||||
----------
|
||||
image : ndarray
|
||||
Input image.
|
||||
preserve_range : bool
|
||||
Determines if the range of the image should be kept or transformed
|
||||
using img_as_float. Also see
|
||||
https://scikit-image.org/docs/dev/user_guide/data_types.html
|
||||
|
||||
Notes
|
||||
-----
|
||||
* Input images with `float32` data type are not upcast.
|
||||
|
||||
Returns
|
||||
-------
|
||||
image : ndarray
|
||||
Transformed version of the input.
|
||||
|
||||
"""
|
||||
if image.dtype == np.float16:
|
||||
return image.astype(np.float32)
|
||||
if preserve_range:
|
||||
# Convert image to double only if it is not single or double
|
||||
# precision float
|
||||
if image.dtype.char not in 'df':
|
||||
image = image.astype(float)
|
||||
else:
|
||||
from .dtype import img_as_float
|
||||
|
||||
image = img_as_float(image)
|
||||
return image
|
||||
319
src/bioxelnodes/bioxel/skimage/_warps.py
Normal file
@@ -0,0 +1,319 @@
|
||||
import warnings
|
||||
import numpy as np
|
||||
from .. import scipy as ndi
|
||||
from ._utils import convert_to_float
|
||||
|
||||
|
||||
def _clip_warp_output(input_image, output_image, mode, cval, clip):
|
||||
"""Clip output image to range of values of input image.
|
||||
|
||||
Note that this function modifies the values of `output_image` in-place
|
||||
and it is only modified if ``clip=True``.
|
||||
|
||||
Parameters
|
||||
----------
|
||||
input_image : ndarray
|
||||
Input image.
|
||||
output_image : ndarray
|
||||
Output image, which is modified in-place.
|
||||
|
||||
Other parameters
|
||||
----------------
|
||||
mode : {'constant', 'edge', 'symmetric', 'reflect', 'wrap'}
|
||||
Points outside the boundaries of the input are filled according
|
||||
to the given mode. Modes match the behaviour of `numpy.pad`.
|
||||
cval : float
|
||||
Used in conjunction with mode 'constant', the value outside
|
||||
the image boundaries.
|
||||
clip : bool
|
||||
Whether to clip the output to the range of values of the input image.
|
||||
This is enabled by default, since higher order interpolation may
|
||||
produce values outside the given input range.
|
||||
|
||||
"""
|
||||
if clip:
|
||||
min_val = np.min(input_image)
|
||||
if np.isnan(min_val):
|
||||
# NaNs detected, use NaN-safe min/max
|
||||
min_func = np.nanmin
|
||||
max_func = np.nanmax
|
||||
min_val = min_func(input_image)
|
||||
else:
|
||||
min_func = np.min
|
||||
max_func = np.max
|
||||
max_val = max_func(input_image)
|
||||
|
||||
# Check if cval has been used such that it expands the effective input
|
||||
# range
|
||||
preserve_cval = (
|
||||
mode == 'constant'
|
||||
and not min_val <= cval <= max_val
|
||||
and min_func(output_image) <= cval <= max_func(output_image)
|
||||
)
|
||||
|
||||
# expand min/max range to account for cval
|
||||
if preserve_cval:
|
||||
# cast cval to the same dtype as the input image
|
||||
cval = input_image.dtype.type(cval)
|
||||
min_val = min(min_val, cval)
|
||||
max_val = max(max_val, cval)
|
||||
|
||||
# Convert array-like types to ndarrays (gh-7159)
|
||||
min_val, max_val = np.asarray(min_val), np.asarray(max_val)
|
||||
np.clip(output_image, min_val, max_val, out=output_image)
|
||||
|
||||
|
||||
def _validate_interpolation_order(image_dtype, order):
|
||||
"""Validate and return spline interpolation's order.
|
||||
|
||||
Parameters
|
||||
----------
|
||||
image_dtype : dtype
|
||||
Image dtype.
|
||||
order : int, optional
|
||||
The order of the spline interpolation. The order has to be in
|
||||
the range 0-5. See `skimage.transform.warp` for detail.
|
||||
|
||||
Returns
|
||||
-------
|
||||
order : int
|
||||
if input order is None, returns 0 if image_dtype is bool and 1
|
||||
otherwise. Otherwise, image_dtype is checked and input order
|
||||
is validated accordingly (order > 0 is not supported for bool
|
||||
image dtype)
|
||||
|
||||
"""
|
||||
|
||||
if order is None:
|
||||
return 0 if image_dtype == bool else 1
|
||||
|
||||
if order < 0 or order > 5:
|
||||
raise ValueError(
|
||||
"Spline interpolation order has to be in the " "range 0-5.")
|
||||
|
||||
if image_dtype == bool and order != 0:
|
||||
raise ValueError(
|
||||
"Input image dtype is bool. Interpolation is not defined "
|
||||
"with bool data type. Please set order to 0 or explicitly "
|
||||
"cast input image to another data type."
|
||||
)
|
||||
|
||||
return order
|
||||
|
||||
|
||||
def _preprocess_resize_output_shape(image, output_shape):
|
||||
"""Validate resize output shape according to input image.
|
||||
|
||||
Parameters
|
||||
----------
|
||||
image: ndarray
|
||||
Image to be resized.
|
||||
output_shape: iterable
|
||||
Size of the generated output image `(rows, cols[, ...][, dim])`. If
|
||||
`dim` is not provided, the number of channels is preserved.
|
||||
|
||||
Returns
|
||||
-------
|
||||
image: ndarray
|
||||
The input image, but with additional singleton dimensions appended in
|
||||
the case where ``len(output_shape) > input.ndim``.
|
||||
output_shape: tuple
|
||||
The output image converted to tuple.
|
||||
|
||||
Raises
|
||||
------
|
||||
ValueError:
|
||||
If output_shape length is smaller than the image number of
|
||||
dimensions
|
||||
|
||||
Notes
|
||||
-----
|
||||
The input image is reshaped if its number of dimensions is not
|
||||
equal to output_shape_length.
|
||||
|
||||
"""
|
||||
output_shape = tuple(output_shape)
|
||||
output_ndim = len(output_shape)
|
||||
input_shape = image.shape
|
||||
if output_ndim > image.ndim:
|
||||
# append dimensions to input_shape
|
||||
input_shape += (1,) * (output_ndim - image.ndim)
|
||||
image = np.reshape(image, input_shape)
|
||||
elif output_ndim == image.ndim - 1:
|
||||
# multichannel case: append shape of last axis
|
||||
output_shape = output_shape + (image.shape[-1],)
|
||||
elif output_ndim < image.ndim:
|
||||
raise ValueError(
|
||||
"output_shape length cannot be smaller than the "
|
||||
"image number of dimensions"
|
||||
)
|
||||
|
||||
return image, output_shape
|
||||
|
||||
|
||||
def _to_ndimage_mode(mode):
|
||||
"""Convert from `numpy.pad` mode name to the corresponding ndimage mode."""
|
||||
mode_translation_dict = dict(
|
||||
constant='constant',
|
||||
edge='nearest',
|
||||
symmetric='reflect',
|
||||
reflect='mirror',
|
||||
wrap='wrap',
|
||||
)
|
||||
if mode not in mode_translation_dict:
|
||||
raise ValueError(
|
||||
f"Unknown mode: '{mode}', or cannot translate mode. The "
|
||||
f"mode should be one of 'constant', 'edge', 'symmetric', "
|
||||
f"'reflect', or 'wrap'. See the documentation of numpy.pad for "
|
||||
f"more info."
|
||||
)
|
||||
return _fix_ndimage_mode(mode_translation_dict[mode])
|
||||
|
||||
|
||||
def _fix_ndimage_mode(mode):
|
||||
# SciPy 1.6.0 introduced grid variants of constant and wrap which
|
||||
# have less surprising behavior for images. Use these when available
|
||||
grid_modes = {'constant': 'grid-constant', 'wrap': 'grid-wrap'}
|
||||
return grid_modes.get(mode, mode)
|
||||
|
||||
|
||||
def resize(
|
||||
image,
|
||||
output_shape,
|
||||
order=None,
|
||||
mode='reflect',
|
||||
cval=0,
|
||||
clip=True,
|
||||
preserve_range=False,
|
||||
anti_aliasing=None,
|
||||
anti_aliasing_sigma=None,
|
||||
):
|
||||
"""Resize image to match a certain size.
|
||||
|
||||
Performs interpolation to up-size or down-size N-dimensional images. Note
|
||||
that anti-aliasing should be enabled when down-sizing images to avoid
|
||||
aliasing artifacts. For downsampling with an integer factor also see
|
||||
`skimage.transform.downscale_local_mean`.
|
||||
|
||||
Parameters
|
||||
----------
|
||||
image : ndarray
|
||||
Input image.
|
||||
output_shape : iterable
|
||||
Size of the generated output image `(rows, cols[, ...][, dim])`. If
|
||||
`dim` is not provided, the number of channels is preserved. In case the
|
||||
number of input channels does not equal the number of output channels a
|
||||
n-dimensional interpolation is applied.
|
||||
|
||||
Returns
|
||||
-------
|
||||
resized : ndarray
|
||||
Resized version of the input.
|
||||
|
||||
Other parameters
|
||||
----------------
|
||||
order : int, optional
|
||||
The order of the spline interpolation, default is 0 if
|
||||
image.dtype is bool and 1 otherwise. The order has to be in
|
||||
the range 0-5. See `skimage.transform.warp` for detail.
|
||||
mode : {'constant', 'edge', 'symmetric', 'reflect', 'wrap'}, optional
|
||||
Points outside the boundaries of the input are filled according
|
||||
to the given mode. Modes match the behaviour of `numpy.pad`.
|
||||
cval : float, optional
|
||||
Used in conjunction with mode 'constant', the value outside
|
||||
the image boundaries.
|
||||
clip : bool, optional
|
||||
Whether to clip the output to the range of values of the input image.
|
||||
This is enabled by default, since higher order interpolation may
|
||||
produce values outside the given input range.
|
||||
preserve_range : bool, optional
|
||||
Whether to keep the original range of values. Otherwise, the input
|
||||
image is converted according to the conventions of `img_as_float`.
|
||||
Also see https://scikit-image.org/docs/dev/user_guide/data_types.html
|
||||
anti_aliasing : bool, optional
|
||||
Whether to apply a Gaussian filter to smooth the image prior
|
||||
to downsampling. It is crucial to filter when downsampling
|
||||
the image to avoid aliasing artifacts. If not specified, it is set to
|
||||
True when downsampling an image whose data type is not bool.
|
||||
It is also set to False when using nearest neighbor interpolation
|
||||
(``order`` == 0) with integer input data type.
|
||||
anti_aliasing_sigma : {float, tuple of floats}, optional
|
||||
Standard deviation for Gaussian filtering used when anti-aliasing.
|
||||
By default, this value is chosen as (s - 1) / 2 where s is the
|
||||
downsampling factor, where s > 1. For the up-size case, s < 1, no
|
||||
anti-aliasing is performed prior to rescaling.
|
||||
|
||||
Notes
|
||||
-----
|
||||
Modes 'reflect' and 'symmetric' are similar, but differ in whether the edge
|
||||
pixels are duplicated during the reflection. As an example, if an array
|
||||
has values [0, 1, 2] and was padded to the right by four values using
|
||||
symmetric, the result would be [0, 1, 2, 2, 1, 0, 0], while for reflect it
|
||||
would be [0, 1, 2, 1, 0, 1, 2].
|
||||
|
||||
Examples
|
||||
--------
|
||||
>>> from skimage import data
|
||||
>>> from skimage.transform import resize
|
||||
>>> image = data.camera()
|
||||
>>> resize(image, (100, 100)).shape
|
||||
(100, 100)
|
||||
|
||||
"""
|
||||
|
||||
image, output_shape = _preprocess_resize_output_shape(image, output_shape)
|
||||
input_shape = image.shape
|
||||
input_type = image.dtype
|
||||
|
||||
if input_type == np.float16:
|
||||
image = image.astype(np.float32)
|
||||
|
||||
if anti_aliasing is None:
|
||||
anti_aliasing = (
|
||||
not input_type == bool
|
||||
and not (np.issubdtype(input_type, np.integer) and order == 0)
|
||||
and any(x < y for x, y in zip(output_shape, input_shape))
|
||||
)
|
||||
|
||||
if input_type == bool and anti_aliasing:
|
||||
raise ValueError("anti_aliasing must be False for boolean images")
|
||||
|
||||
factors = np.divide(input_shape, output_shape)
|
||||
order = _validate_interpolation_order(input_type, order)
|
||||
if order > 0:
|
||||
image = convert_to_float(image, preserve_range)
|
||||
|
||||
# Translate modes used by np.pad to those used by scipy.ndimage
|
||||
ndi_mode = _to_ndimage_mode(mode)
|
||||
if anti_aliasing:
|
||||
if anti_aliasing_sigma is None:
|
||||
anti_aliasing_sigma = np.maximum(0, (factors - 1) / 2)
|
||||
else:
|
||||
anti_aliasing_sigma = np.atleast_1d(anti_aliasing_sigma) * np.ones_like(
|
||||
factors
|
||||
)
|
||||
if np.any(anti_aliasing_sigma < 0):
|
||||
raise ValueError(
|
||||
"Anti-aliasing standard deviation must be "
|
||||
"greater than or equal to zero"
|
||||
)
|
||||
elif np.any((anti_aliasing_sigma > 0) & (factors <= 1)):
|
||||
warnings.warn(
|
||||
"Anti-aliasing standard deviation greater than zero but "
|
||||
"not down-sampling along all axes",
|
||||
stacklevel=2
|
||||
)
|
||||
filtered = ndi.gaussian_filter(
|
||||
image, anti_aliasing_sigma, cval=cval, mode=ndi_mode
|
||||
)
|
||||
else:
|
||||
filtered = image
|
||||
|
||||
zoom_factors = [1 / f for f in factors]
|
||||
out = ndi.zoom(
|
||||
filtered, zoom_factors, order=order, mode=ndi_mode, cval=cval, grid_mode=True
|
||||
)
|
||||
|
||||
_clip_warp_output(image, out, mode, cval, clip)
|
||||
|
||||
return out
|
||||
605
src/bioxelnodes/bioxel/skimage/dtype.py
Normal file
@@ -0,0 +1,605 @@
|
||||
import warnings
|
||||
from warnings import warn
|
||||
|
||||
import numpy as np
|
||||
|
||||
|
||||
__all__ = [
|
||||
'img_as_float32',
|
||||
'img_as_float64',
|
||||
'img_as_float',
|
||||
'img_as_int',
|
||||
'img_as_uint',
|
||||
'img_as_ubyte',
|
||||
'img_as_bool',
|
||||
'dtype_limits',
|
||||
]
|
||||
|
||||
# Some of these may or may not be aliases depending on architecture & platform
|
||||
_integer_types = (
|
||||
np.int8,
|
||||
np.byte,
|
||||
np.int16,
|
||||
np.short,
|
||||
np.int32,
|
||||
np.int64,
|
||||
np.longlong,
|
||||
np.int_,
|
||||
np.intp,
|
||||
np.intc,
|
||||
int,
|
||||
np.uint8,
|
||||
np.ubyte,
|
||||
np.uint16,
|
||||
np.ushort,
|
||||
np.uint32,
|
||||
np.uint64,
|
||||
np.ulonglong,
|
||||
np.uint,
|
||||
np.uintp,
|
||||
np.uintc,
|
||||
)
|
||||
_integer_ranges = {t: (np.iinfo(t).min, np.iinfo(t).max)
|
||||
for t in _integer_types}
|
||||
dtype_range = {
|
||||
bool: (False, True),
|
||||
np.bool_: (False, True),
|
||||
float: (-1, 1),
|
||||
np.float16: (-1, 1),
|
||||
np.float32: (-1, 1),
|
||||
np.float64: (-1, 1),
|
||||
}
|
||||
|
||||
with warnings.catch_warnings():
|
||||
warnings.filterwarnings('ignore', category=DeprecationWarning)
|
||||
|
||||
# np.bool8 is a deprecated alias of np.bool_
|
||||
if hasattr(np, 'bool8'):
|
||||
dtype_range[np.bool8] = (False, True)
|
||||
|
||||
dtype_range.update(_integer_ranges)
|
||||
|
||||
_supported_types = list(dtype_range.keys())
|
||||
|
||||
|
||||
def dtype_limits(image, clip_negative=False):
|
||||
"""Return intensity limits, i.e. (min, max) tuple, of the image's dtype.
|
||||
|
||||
Parameters
|
||||
----------
|
||||
image : ndarray
|
||||
Input image.
|
||||
clip_negative : bool, optional
|
||||
If True, clip the negative range (i.e. return 0 for min intensity)
|
||||
even if the image dtype allows negative values.
|
||||
|
||||
Returns
|
||||
-------
|
||||
imin, imax : tuple
|
||||
Lower and upper intensity limits.
|
||||
"""
|
||||
imin, imax = dtype_range[image.dtype.type]
|
||||
if clip_negative:
|
||||
imin = 0
|
||||
return imin, imax
|
||||
|
||||
|
||||
def _dtype_itemsize(itemsize, *dtypes):
|
||||
"""Return first of `dtypes` with itemsize greater than `itemsize`
|
||||
|
||||
Parameters
|
||||
----------
|
||||
itemsize: int
|
||||
The data type object element size.
|
||||
|
||||
Other Parameters
|
||||
----------------
|
||||
*dtypes:
|
||||
Any Object accepted by `np.dtype` to be converted to a data
|
||||
type object
|
||||
|
||||
Returns
|
||||
-------
|
||||
dtype: data type object
|
||||
First of `dtypes` with itemsize greater than `itemsize`.
|
||||
|
||||
"""
|
||||
return next(dt for dt in dtypes if np.dtype(dt).itemsize >= itemsize)
|
||||
|
||||
|
||||
def _dtype_bits(kind, bits, itemsize=1):
|
||||
"""Return dtype of `kind` that can store a `bits` wide unsigned int
|
||||
|
||||
Parameters:
|
||||
kind: str
|
||||
Data type kind.
|
||||
bits: int
|
||||
Desired number of bits.
|
||||
itemsize: int
|
||||
The data type object element size.
|
||||
|
||||
Returns
|
||||
-------
|
||||
dtype: data type object
|
||||
Data type of `kind` that can store a `bits` wide unsigned int
|
||||
|
||||
"""
|
||||
|
||||
s = next(
|
||||
i
|
||||
for i in (itemsize,) + (2, 4, 8)
|
||||
if bits < (i * 8) or (bits == (i * 8) and kind == 'u')
|
||||
)
|
||||
|
||||
return np.dtype(kind + str(s))
|
||||
|
||||
|
||||
def _scale(a, n, m, copy=True):
|
||||
"""Scale an array of unsigned/positive integers from `n` to `m` bits.
|
||||
|
||||
Numbers can be represented exactly only if `m` is a multiple of `n`.
|
||||
|
||||
Parameters
|
||||
----------
|
||||
a : ndarray
|
||||
Input image array.
|
||||
n : int
|
||||
Number of bits currently used to encode the values in `a`.
|
||||
m : int
|
||||
Desired number of bits to encode the values in `out`.
|
||||
copy : bool, optional
|
||||
If True, allocates and returns new array. Otherwise, modifies
|
||||
`a` in place.
|
||||
|
||||
Returns
|
||||
-------
|
||||
out : array
|
||||
Output image array. Has the same kind as `a`.
|
||||
"""
|
||||
kind = a.dtype.kind
|
||||
if n > m and a.max() < 2**m:
|
||||
mnew = int(np.ceil(m / 2) * 2)
|
||||
if mnew > m:
|
||||
dtype = f'int{mnew}'
|
||||
else:
|
||||
dtype = f'uint{mnew}'
|
||||
n = int(np.ceil(n / 2) * 2)
|
||||
warn(
|
||||
f'Downcasting {a.dtype} to {dtype} without scaling because max '
|
||||
f'value {a.max()} fits in {dtype}',
|
||||
stacklevel=3,
|
||||
)
|
||||
return a.astype(_dtype_bits(kind, m))
|
||||
elif n == m:
|
||||
return a.copy() if copy else a
|
||||
elif n > m:
|
||||
# downscale with precision loss
|
||||
if copy:
|
||||
b = np.empty(a.shape, _dtype_bits(kind, m))
|
||||
np.floor_divide(a, 2 ** (n - m), out=b,
|
||||
dtype=a.dtype, casting='unsafe')
|
||||
return b
|
||||
else:
|
||||
a //= 2 ** (n - m)
|
||||
return a
|
||||
elif m % n == 0:
|
||||
# exact upscale to a multiple of `n` bits
|
||||
if copy:
|
||||
b = np.empty(a.shape, _dtype_bits(kind, m))
|
||||
np.multiply(a, (2**m - 1) // (2**n - 1), out=b, dtype=b.dtype)
|
||||
return b
|
||||
else:
|
||||
a = a.astype(_dtype_bits(kind, m, a.dtype.itemsize), copy=False)
|
||||
a *= (2**m - 1) // (2**n - 1)
|
||||
return a
|
||||
else:
|
||||
# upscale to a multiple of `n` bits,
|
||||
# then downscale with precision loss
|
||||
o = (m // n + 1) * n
|
||||
if copy:
|
||||
b = np.empty(a.shape, _dtype_bits(kind, o))
|
||||
np.multiply(a, (2**o - 1) // (2**n - 1), out=b, dtype=b.dtype)
|
||||
b //= 2 ** (o - m)
|
||||
return b
|
||||
else:
|
||||
a = a.astype(_dtype_bits(kind, o, a.dtype.itemsize), copy=False)
|
||||
a *= (2**o - 1) // (2**n - 1)
|
||||
a //= 2 ** (o - m)
|
||||
return a
|
||||
|
||||
|
||||
def _convert(image, dtype, force_copy=False, uniform=False):
|
||||
"""
|
||||
Convert an image to the requested data-type.
|
||||
|
||||
Warnings are issued in case of precision loss, or when negative values
|
||||
are clipped during conversion to unsigned integer types (sign loss).
|
||||
|
||||
Floating point values are expected to be normalized and will be clipped
|
||||
to the range [0.0, 1.0] or [-1.0, 1.0] when converting to unsigned or
|
||||
signed integers respectively.
|
||||
|
||||
Numbers are not shifted to the negative side when converting from
|
||||
unsigned to signed integer types. Negative values will be clipped when
|
||||
converting to unsigned integers.
|
||||
|
||||
Parameters
|
||||
----------
|
||||
image : ndarray
|
||||
Input image.
|
||||
dtype : dtype
|
||||
Target data-type.
|
||||
force_copy : bool, optional
|
||||
Force a copy of the data, irrespective of its current dtype.
|
||||
uniform : bool, optional
|
||||
Uniformly quantize the floating point range to the integer range.
|
||||
By default (uniform=False) floating point values are scaled and
|
||||
rounded to the nearest integers, which minimizes back and forth
|
||||
conversion errors.
|
||||
|
||||
.. versionchanged:: 0.15
|
||||
``_convert`` no longer warns about possible precision or sign
|
||||
information loss. See discussions on these warnings at:
|
||||
https://github.com/scikit-image/scikit-image/issues/2602
|
||||
https://github.com/scikit-image/scikit-image/issues/543#issuecomment-208202228
|
||||
https://github.com/scikit-image/scikit-image/pull/3575
|
||||
|
||||
References
|
||||
----------
|
||||
.. [1] DirectX data conversion rules.
|
||||
https://msdn.microsoft.com/en-us/library/windows/desktop/dd607323%28v=vs.85%29.aspx
|
||||
.. [2] Data Conversions. In "OpenGL ES 2.0 Specification v2.0.25",
|
||||
pp 7-8. Khronos Group, 2010.
|
||||
.. [3] Proper treatment of pixels as integers. A.W. Paeth.
|
||||
In "Graphics Gems I", pp 249-256. Morgan Kaufmann, 1990.
|
||||
.. [4] Dirty Pixels. J. Blinn. In "Jim Blinn's corner: Dirty Pixels",
|
||||
pp 47-57. Morgan Kaufmann, 1998.
|
||||
|
||||
"""
|
||||
image = np.asarray(image)
|
||||
dtypeobj_in = image.dtype
|
||||
if dtype is np.floating:
|
||||
dtypeobj_out = np.dtype('float64')
|
||||
else:
|
||||
dtypeobj_out = np.dtype(dtype)
|
||||
dtype_in = dtypeobj_in.type
|
||||
dtype_out = dtypeobj_out.type
|
||||
kind_in = dtypeobj_in.kind
|
||||
kind_out = dtypeobj_out.kind
|
||||
itemsize_in = dtypeobj_in.itemsize
|
||||
itemsize_out = dtypeobj_out.itemsize
|
||||
|
||||
# Below, we do an `issubdtype` check. Its purpose is to find out
|
||||
# whether we can get away without doing any image conversion. This happens
|
||||
# when:
|
||||
#
|
||||
# - the output and input dtypes are the same or
|
||||
# - when the output is specified as a type, and the input dtype
|
||||
# is a subclass of that type (e.g. `np.floating` will allow
|
||||
# `float32` and `float64` arrays through)
|
||||
|
||||
if np.issubdtype(dtype_in, dtype):
|
||||
if force_copy:
|
||||
image = image.copy()
|
||||
return image
|
||||
|
||||
if not (dtype_in in _supported_types and dtype_out in _supported_types):
|
||||
raise ValueError(
|
||||
f'Cannot convert from {dtypeobj_in} to ' f'{dtypeobj_out}.')
|
||||
|
||||
if kind_in in 'ui':
|
||||
imin_in = np.iinfo(dtype_in).min
|
||||
imax_in = np.iinfo(dtype_in).max
|
||||
if kind_out in 'ui':
|
||||
imin_out = np.iinfo(dtype_out).min
|
||||
imax_out = np.iinfo(dtype_out).max
|
||||
|
||||
# any -> binary
|
||||
if kind_out == 'b':
|
||||
return image > dtype_in(dtype_range[dtype_in][1] / 2)
|
||||
|
||||
# binary -> any
|
||||
if kind_in == 'b':
|
||||
result = image.astype(dtype_out)
|
||||
if kind_out != 'f':
|
||||
result *= dtype_out(dtype_range[dtype_out][1])
|
||||
return result
|
||||
|
||||
# float -> any
|
||||
if kind_in == 'f':
|
||||
if kind_out == 'f':
|
||||
# float -> float
|
||||
return image.astype(dtype_out)
|
||||
|
||||
if np.min(image) < -1.0 or np.max(image) > 1.0:
|
||||
raise ValueError("Images of type float must be between -1 and 1.")
|
||||
# floating point -> integer
|
||||
# use float type that can represent output integer type
|
||||
computation_type = _dtype_itemsize(
|
||||
itemsize_out, dtype_in, np.float32, np.float64
|
||||
)
|
||||
|
||||
if not uniform:
|
||||
if kind_out == 'u':
|
||||
image_out = np.multiply(
|
||||
image, imax_out, dtype=computation_type)
|
||||
else:
|
||||
image_out = np.multiply(
|
||||
image, (imax_out - imin_out) / 2, dtype=computation_type
|
||||
)
|
||||
image_out -= 1.0 / 2.0
|
||||
np.rint(image_out, out=image_out)
|
||||
np.clip(image_out, imin_out, imax_out, out=image_out)
|
||||
elif kind_out == 'u':
|
||||
image_out = np.multiply(
|
||||
image, imax_out + 1, dtype=computation_type)
|
||||
np.clip(image_out, 0, imax_out, out=image_out)
|
||||
else:
|
||||
image_out = np.multiply(
|
||||
image, (imax_out - imin_out + 1.0) / 2.0, dtype=computation_type
|
||||
)
|
||||
np.floor(image_out, out=image_out)
|
||||
np.clip(image_out, imin_out, imax_out, out=image_out)
|
||||
return image_out.astype(dtype_out)
|
||||
|
||||
# signed/unsigned int -> float
|
||||
if kind_out == 'f':
|
||||
# use float type that can exactly represent input integers
|
||||
computation_type = _dtype_itemsize(
|
||||
itemsize_in, dtype_out, np.float32, np.float64
|
||||
)
|
||||
|
||||
if kind_in == 'u':
|
||||
# using np.divide or np.multiply doesn't copy the data
|
||||
# until the computation time
|
||||
image = np.multiply(image, 1.0 / imax_in, dtype=computation_type)
|
||||
# DirectX uses this conversion also for signed ints
|
||||
# if imin_in:
|
||||
# np.maximum(image, -1.0, out=image)
|
||||
elif kind_in == 'i':
|
||||
# From DirectX conversions:
|
||||
# The most negative value maps to -1.0f
|
||||
# Every other value is converted to a float (call it c)
|
||||
# and then result = c * (1.0f / (2⁽ⁿ⁻¹⁾-1)).
|
||||
|
||||
image = np.multiply(image, 1.0 / imax_in, dtype=computation_type)
|
||||
np.maximum(image, -1.0, out=image)
|
||||
|
||||
else:
|
||||
image = np.add(image, 0.5, dtype=computation_type)
|
||||
image *= 2 / (imax_in - imin_in)
|
||||
|
||||
return np.asarray(image, dtype_out)
|
||||
|
||||
# unsigned int -> signed/unsigned int
|
||||
if kind_in == 'u':
|
||||
if kind_out == 'i':
|
||||
# unsigned int -> signed int
|
||||
image = _scale(image, 8 * itemsize_in, 8 * itemsize_out - 1)
|
||||
return image.view(dtype_out)
|
||||
else:
|
||||
# unsigned int -> unsigned int
|
||||
return _scale(image, 8 * itemsize_in, 8 * itemsize_out)
|
||||
|
||||
# signed int -> unsigned int
|
||||
if kind_out == 'u':
|
||||
image = _scale(image, 8 * itemsize_in - 1, 8 * itemsize_out)
|
||||
result = np.empty(image.shape, dtype_out)
|
||||
np.maximum(image, 0, out=result, dtype=image.dtype, casting='unsafe')
|
||||
return result
|
||||
|
||||
# signed int -> signed int
|
||||
if itemsize_in > itemsize_out:
|
||||
return _scale(image, 8 * itemsize_in - 1, 8 * itemsize_out - 1)
|
||||
|
||||
image = image.astype(_dtype_bits('i', itemsize_out * 8))
|
||||
image -= imin_in
|
||||
image = _scale(image, 8 * itemsize_in, 8 * itemsize_out, copy=False)
|
||||
image += imin_out
|
||||
return image.astype(dtype_out)
|
||||
|
||||
|
||||
def convert(image, dtype, force_copy=False, uniform=False):
|
||||
warn(
|
||||
"The use of this function is discouraged as its behavior may change "
|
||||
"dramatically in scikit-image 1.0. This function will be removed "
|
||||
"in scikit-image 1.0.",
|
||||
FutureWarning,
|
||||
stacklevel=2,
|
||||
)
|
||||
return _convert(image=image, dtype=dtype, force_copy=force_copy, uniform=uniform)
|
||||
|
||||
|
||||
if _convert.__doc__ is not None:
|
||||
convert.__doc__ = (
|
||||
_convert.__doc__
|
||||
+ """
|
||||
|
||||
Warns
|
||||
-----
|
||||
FutureWarning:
|
||||
.. versionadded:: 0.17
|
||||
|
||||
The use of this function is discouraged as its behavior may change
|
||||
dramatically in scikit-image 1.0. This function will be removed
|
||||
in scikit-image 1.0.
|
||||
"""
|
||||
)
|
||||
|
||||
|
||||
def img_as_float32(image, force_copy=False):
|
||||
"""Convert an image to single-precision (32-bit) floating point format.
|
||||
|
||||
Parameters
|
||||
----------
|
||||
image : ndarray
|
||||
Input image.
|
||||
force_copy : bool, optional
|
||||
Force a copy of the data, irrespective of its current dtype.
|
||||
|
||||
Returns
|
||||
-------
|
||||
out : ndarray of float32
|
||||
Output image.
|
||||
|
||||
Notes
|
||||
-----
|
||||
The range of a floating point image is [0.0, 1.0] or [-1.0, 1.0] when
|
||||
converting from unsigned or signed datatypes, respectively.
|
||||
If the input image has a float type, intensity values are not modified
|
||||
and can be outside the ranges [0.0, 1.0] or [-1.0, 1.0].
|
||||
|
||||
"""
|
||||
return _convert(image, np.float32, force_copy)
|
||||
|
||||
|
||||
def img_as_float64(image, force_copy=False):
|
||||
"""Convert an image to double-precision (64-bit) floating point format.
|
||||
|
||||
Parameters
|
||||
----------
|
||||
image : ndarray
|
||||
Input image.
|
||||
force_copy : bool, optional
|
||||
Force a copy of the data, irrespective of its current dtype.
|
||||
|
||||
Returns
|
||||
-------
|
||||
out : ndarray of float64
|
||||
Output image.
|
||||
|
||||
Notes
|
||||
-----
|
||||
The range of a floating point image is [0.0, 1.0] or [-1.0, 1.0] when
|
||||
converting from unsigned or signed datatypes, respectively.
|
||||
If the input image has a float type, intensity values are not modified
|
||||
and can be outside the ranges [0.0, 1.0] or [-1.0, 1.0].
|
||||
|
||||
"""
|
||||
return _convert(image, np.float64, force_copy)
|
||||
|
||||
|
||||
def img_as_float(image, force_copy=False):
|
||||
"""Convert an image to floating point format.
|
||||
|
||||
This function is similar to `img_as_float64`, but will not convert
|
||||
lower-precision floating point arrays to `float64`.
|
||||
|
||||
Parameters
|
||||
----------
|
||||
image : ndarray
|
||||
Input image.
|
||||
force_copy : bool, optional
|
||||
Force a copy of the data, irrespective of its current dtype.
|
||||
|
||||
Returns
|
||||
-------
|
||||
out : ndarray of float
|
||||
Output image.
|
||||
|
||||
Notes
|
||||
-----
|
||||
The range of a floating point image is [0.0, 1.0] or [-1.0, 1.0] when
|
||||
converting from unsigned or signed datatypes, respectively.
|
||||
If the input image has a float type, intensity values are not modified
|
||||
and can be outside the ranges [0.0, 1.0] or [-1.0, 1.0].
|
||||
|
||||
"""
|
||||
return _convert(image, np.floating, force_copy)
|
||||
|
||||
|
||||
def img_as_uint(image, force_copy=False):
|
||||
"""Convert an image to 16-bit unsigned integer format.
|
||||
|
||||
Parameters
|
||||
----------
|
||||
image : ndarray
|
||||
Input image.
|
||||
force_copy : bool, optional
|
||||
Force a copy of the data, irrespective of its current dtype.
|
||||
|
||||
Returns
|
||||
-------
|
||||
out : ndarray of uint16
|
||||
Output image.
|
||||
|
||||
Notes
|
||||
-----
|
||||
Negative input values will be clipped.
|
||||
Positive values are scaled between 0 and 65535.
|
||||
|
||||
"""
|
||||
return _convert(image, np.uint16, force_copy)
|
||||
|
||||
|
||||
def img_as_int(image, force_copy=False):
|
||||
"""Convert an image to 16-bit signed integer format.
|
||||
|
||||
Parameters
|
||||
----------
|
||||
image : ndarray
|
||||
Input image.
|
||||
force_copy : bool, optional
|
||||
Force a copy of the data, irrespective of its current dtype.
|
||||
|
||||
Returns
|
||||
-------
|
||||
out : ndarray of int16
|
||||
Output image.
|
||||
|
||||
Notes
|
||||
-----
|
||||
The values are scaled between -32768 and 32767.
|
||||
If the input data-type is positive-only (e.g., uint8), then
|
||||
the output image will still only have positive values.
|
||||
|
||||
"""
|
||||
return _convert(image, np.int16, force_copy)
|
||||
|
||||
|
||||
def img_as_ubyte(image, force_copy=False):
|
||||
"""Convert an image to 8-bit unsigned integer format.
|
||||
|
||||
Parameters
|
||||
----------
|
||||
image : ndarray
|
||||
Input image.
|
||||
force_copy : bool, optional
|
||||
Force a copy of the data, irrespective of its current dtype.
|
||||
|
||||
Returns
|
||||
-------
|
||||
out : ndarray of ubyte (uint8)
|
||||
Output image.
|
||||
|
||||
Notes
|
||||
-----
|
||||
Negative input values will be clipped.
|
||||
Positive values are scaled between 0 and 255.
|
||||
|
||||
"""
|
||||
return _convert(image, np.uint8, force_copy)
|
||||
|
||||
|
||||
def img_as_bool(image, force_copy=False):
|
||||
"""Convert an image to boolean format.
|
||||
|
||||
Parameters
|
||||
----------
|
||||
image : ndarray
|
||||
Input image.
|
||||
force_copy : bool, optional
|
||||
Force a copy of the data, irrespective of its current dtype.
|
||||
|
||||
Returns
|
||||
-------
|
||||
out : ndarray of bool (`bool_`)
|
||||
Output image.
|
||||
|
||||
Notes
|
||||
-----
|
||||
The upper half of the input dtype's positive range is True, and the lower
|
||||
half is False. All negative values (if present) are False.
|
||||
|
||||
"""
|
||||
return _convert(image, bool, force_copy)
|
||||
@@ -1,12 +1,12 @@
|
||||
schema_version = "1.0.0"
|
||||
|
||||
id = "bioxelnodes"
|
||||
version = "2.0.4"
|
||||
version = "2.0.0"
|
||||
name = "Bioxel Nodes"
|
||||
tagline = "For scientific volumetric data visualization in Blender"
|
||||
maintainer = "Nan <icrdr2010@outlook.com>"
|
||||
type = "add-on"
|
||||
website = "https://docs.omoolab.xyz/bioxelnodes/"
|
||||
website = "https://omoolab.github.io/BioxelNodes/latest"
|
||||
|
||||
tags = ["Geometry Nodes", "Render", "Import-Export"]
|
||||
blender_version_min = "5.0.0"
|
||||
@@ -29,13 +29,12 @@ wheels = [
|
||||
"./wheels/matplotlib-3.10.7-cp311-cp311-win_amd64.whl",
|
||||
"./wheels/matplotlib-3.10.7-cp313-cp313-win_amd64.whl",
|
||||
"./wheels/mrcfile-1.5.1-py2.py3-none-any.whl",
|
||||
"./wheels/packaging-26.2-py3-none-any.whl",
|
||||
"./wheels/pillow-11.2.1-cp311-cp311-win_amd64.whl",
|
||||
"./wheels/pillow-11.2.1-cp313-cp313-win_amd64.whl",
|
||||
"./wheels/pyometiff-1.0.0-py3-none-any.whl",
|
||||
"./wheels/pyparsing-3.3.2-py3-none-any.whl",
|
||||
"./wheels/python_dateutil-2.9.0.post0-py2.py3-none-any.whl",
|
||||
"./wheels/scipy-1.17.1-cp311-cp311-win_amd64.whl",
|
||||
"./wheels/scipy-1.17.1-cp313-cp313-win_amd64.whl",
|
||||
"./wheels/simpleitk-2.5.5-cp311-abi3-win_amd64.whl",
|
||||
"./wheels/six-1.17.0-py2.py3-none-any.whl",
|
||||
"./wheels/tifffile-2024.7.24-py3-none-any.whl",
|
||||
|
||||
@@ -227,18 +227,20 @@ def set_layer_caches(layers_data: List[Dict[str, Any]]):
|
||||
layers_text.write(json.dumps(layers_data, indent=4))
|
||||
|
||||
|
||||
def save_layers_to_cache(layers: List[Layer], cache_dir: str) -> List[Dict[str, Any]]:
|
||||
def save_layers_to_json(layers: List[Layer], cache_dir: str) -> List[int]:
|
||||
"""
|
||||
Save multiple Layer objects into cache folders.
|
||||
Save multiple Layer objects into the internal layers text datablock.
|
||||
|
||||
For each layer:
|
||||
- Generates a unique cache id.
|
||||
- Writes VDB files and a low-resolution snapshot (.npy) plus PNG slices under cache_dir/<cache_id>/.
|
||||
- Appends an entry describing the layer into the b i o x e l _ l a y e r s text datablock.
|
||||
|
||||
Returns:
|
||||
- List of layer cache metadata dictionaries.
|
||||
- List of generated cache ids for the saved layers.
|
||||
"""
|
||||
cache_infos = []
|
||||
existing_data = get_layer_caches()
|
||||
added_ids = []
|
||||
|
||||
cache_dir_path = Path(cache_dir)
|
||||
cache_dir_path.mkdir(parents=True, exist_ok=True)
|
||||
@@ -268,22 +270,8 @@ def save_layers_to_cache(layers: List[Layer], cache_dir: str) -> List[Dict[str,
|
||||
"snapshot_z": 0.5,
|
||||
}
|
||||
|
||||
cache_infos.append(cache_info)
|
||||
|
||||
return cache_infos
|
||||
|
||||
|
||||
def save_layers_to_json(layers: List[Layer], cache_dir: str) -> List[int]:
|
||||
"""
|
||||
Save multiple Layer objects into cache folders and the internal layers text datablock.
|
||||
"""
|
||||
existing_data = get_layer_caches()
|
||||
cache_infos = save_layers_to_cache(layers, cache_dir)
|
||||
|
||||
added_ids = []
|
||||
for cache_info in cache_infos:
|
||||
existing_data.append(cache_info)
|
||||
added_ids.append(cache_info["id"])
|
||||
added_ids.append(cache_id)
|
||||
|
||||
set_layer_caches(existing_data)
|
||||
print(f"Successfully added {len(added_ids)} layers to the internal text datablock")
|
||||
|
||||